Severity: Notice
Message: Undefined variable: content_category
Filename: user/transcript.php
Line Number: 106
Severity: Warning
Message: Invalid argument supplied for foreach()
Filename: user/transcript.php
Line Number: 106


1) New York Consumer Guide to Health Insurance Companies 2015 New York State Andrew M. Cuomo, Governor
2) Table of Contents ABOUT THIS GUIDE .......................................................................................... 2 COMPLAINTS .................................................................................................... 4 PROMPT PAY COMPLAINTS .............................................................................. 9 INTERNAL APPEALS ........................................................................................ 14 EXTERNAL APPEALS........................................................................................ 19 GRIEVANCES ................................................................................................. 24 ACCESS AND SERVICE .................................................................................. 29 CHILD AND ADOLESCENT HEALTH ................................................................. 32 ADULT HEALTH .............................................................................................. 35 WOMEN’S HEALTH ....................................................................................... 38 BEHAVIORAL HEALTH ..................................................................................... 41 QUALITY OF PROVIDERS ............................................................................... 44 MANAGING MEDICATIONS........................................................................... 47 HEALTH INSURANCE COMPANY ACCREDITATION .......................................... 50 HOW HEALTH INSURANCE COMPANIES PAY HEALTH CARE PROVIDERS....... 53 OVERALL COMPLAINT RANKING ................................................................... 54 TELEPHONE NUMBERS FOR HEALTH INSURANCE COMPANIES ....................... 58 CONTACTS AND RESOURCES ........................................................................ 60
3) 2 New York Consumer Guide to Health Insurance Companies and Plans ï‚· DOH collects data through the New York State Department of Health’s Quality Assurance Reporting Requirements (QARR) and the Consumer Assessment of Healthcare Providers and Systems (CAHPS®).1 ABOUT THIS GUIDE The purpose of this Guide is to: ï‚· Inform you of the health insurance products offered in New York State and how they work. ï‚· Help you choose a health insurance company based on quality of care and service. DATA SOURCES The information in this Guide is provided by two New York agencies. 1. New York State Department of Financial Services (DFS) is responsible for protecting the public interest by supervising and regulating financial products and services, including those subject to the provisions of the Insurance Law and the Banking Law in New York State. ï‚· DFS compiles the complaint and appeal information that appears on pages 4–23 and the grievance information that appears on pages 24-28. ï‚· DFS data are from calendar year 2014. 2. New York State Department of Health (DOH) works to protect and promote the health of New Yorkers through prevention, research and by ensuring delivery of quality health care. DOH compiles its portion of the complaint data on page 5 and the information on health insurance company performance that appears on pages 2949. ï‚· DOH data on quality of care and service for health insurance companies are from calendar year 2013, except where noted. DETAILS ABOUT THE DATA ï‚· The Guide does not include: – HMOs with less than $25 million in premiums or fewer than 5,000 members. – Commercial and EPO/PPO plans with less than $50 million in premiums. – Data for Medicare, Medicaid or self-insured plans.2 ï‚· Health insurance companies are listed alphabetically in the data tables, except for the Overall Complaint Ranking table on pages 54-57. ï‚· Some health insurance companies are listed using different names depending on whether the data are reported by DFS or DOH. 1 CAHPS® is a registered trademark of the Agency for Healthcare Research and Quality (AHRQ). 2 For information about Medicare coverage, call the Centers for Medicare & Medicaid Services (CMS), the federal agency that oversees this program, at 800-MEDICARE (800-633-4227), or visit the website at www.medicare.gov. You can also contact the New York State Office for the Aging Health Insurance Information Counseling & Assistance Program (HIICAP) by calling 800-701-0501, or by visiting the website at www.aging.ny.gov/healthbenefits/. For information on New York’s Medicaid program, contact your local county Department of Social Services.
4) 3 New York Consumer Guide to Health Insurance Companies and Plans HEALTH INSURANCE COMPANY AND PLAN DEFINITIONS Health Maintenance Organization (HMO) Plan: A type of coverage that provides comprehensive health services to members in return for a monthly premium and copayment. In an HMO plan, members choose an in-network primary care physician (PCP) who coordinates each assigned member’s care. Members need a referral from their PCP to obtain services from in-network specialists and provider services. Although many HMOs require their members to go to doctors and other providers in the HMO provider network, some HMO plans offer the option to go out-of-network (for example in a HMO Point of Service (POS) plan). Unless a member has an HMO Plan that offers an out-ofnetwork option, out-of-network services are usually not covered. Exclusive Provider Organization (EPO) Plan: A type of coverage in which the insurer contracts with doctors, hospitals and other types of providers to form a network of providers. Certain services may require pre-authorization. In an EPO, members must use the providers who belong to the EPO network or their expenses will not be covered. Preferred Provider Organization (PPO) Plan: A type of managed care coverage based on a network of doctors and hospitals that provides care to an enrolled population at a prearranged discounted rate. PPO members do not usually need a referral to see a specialist, but certain services may require pre-authorization from the health insurance company. PPO members may use out-of-network providers however, members usually pay more when they receive care outside the PPO network. Commercial Insurers: Health insurance can also be written by life insurers, property/casualty insurers and other types of insurers. Commercial insurers employ managed care strategies but offer a more traditional approach to coverage than HMOs. Policyholders are subject to deductibles and significant out-of-pocket costs unless they use a preferred provider network.
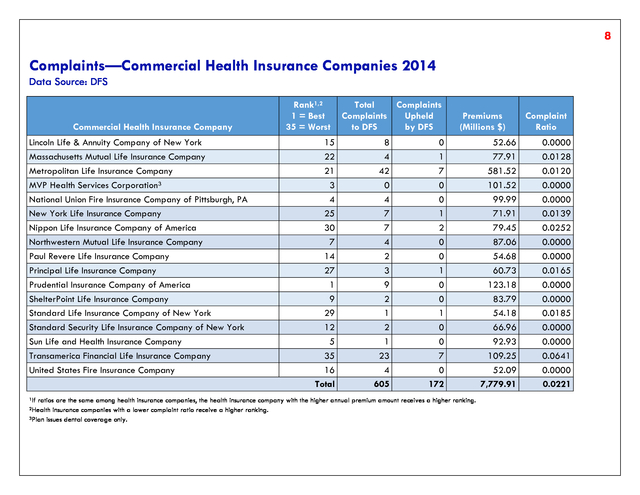
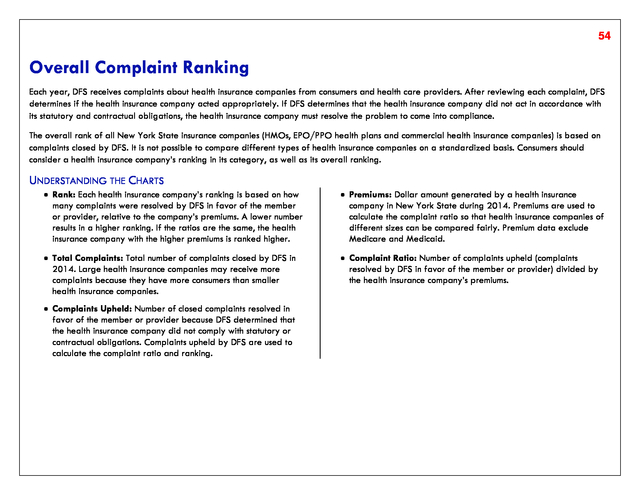
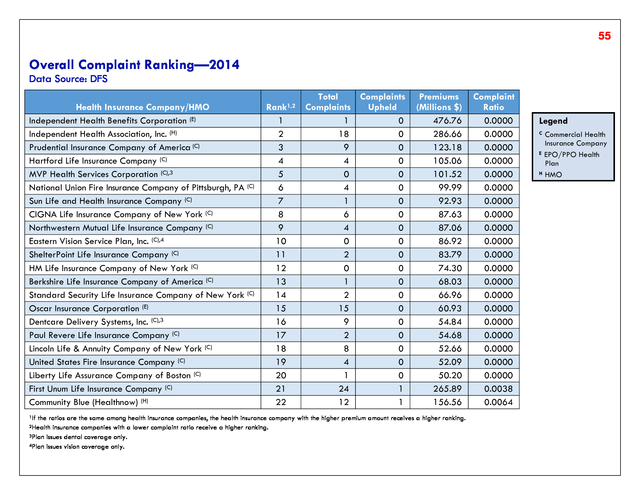
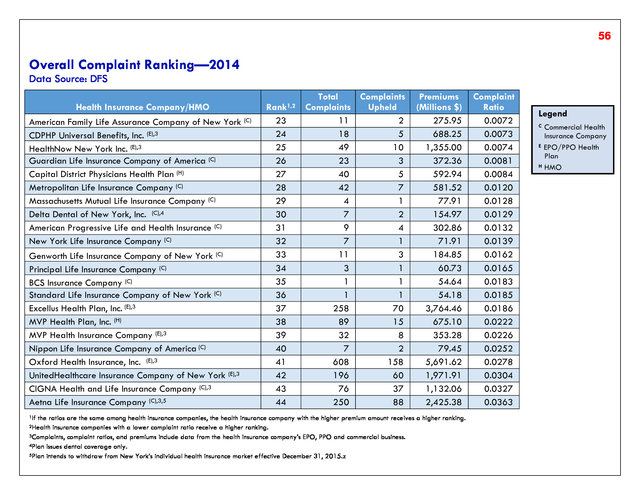
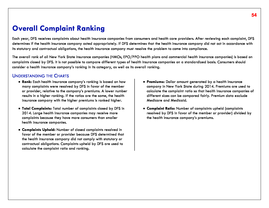
5) 4 Complaints Each year, the New York State DFS and DOH receives complaints from consumers and health care providers about health insurance companies. Complaints typically involve issues related to prompt payment, reimbursement, coverage, benefits, rates and premiums. After reviewing each complaint, the State determines if the health insurance company acted appropriately. If the State determines that the health insurance company did not act in accordance with its statutory and contractual obligations, the company must resolve the problem to come into compliance. For issues concerning payment, reimbursement, coverage, benefits, rates and premiums, contact DFS at: www.dfs.ny.gov/consumer/fileacomplaint.htm or call 800-342-3736. UNDERSTANDING THE CHARTS ï‚· Rank: Each health insurance company’s rank is based on how many complaints were resolved by DFS in favor of the member or provider, relative to the company’s premiums. A lower number results in a higher ranking. If the ratios are the same, the health insurance company with the higher premiums is ranked higher. ï‚· Premiums: Dollar amount generated by a health insurance company in New York State during 2014. Premiums are used to calculate the complaint ratio so that health insurance companies of different sizes can be compared fairly. Premium data exclude Medicare and Medicaid. ï‚· Total Complaints to DFS: Total number of complaints closed by DFS in 2014. Large health insurance companies may receive more complaints because they have more members than smaller health insurance companies. ï‚· Complaint Ratio: Number of complaints upheld (complaints resolved in favor of the member or provider) by DFS, divided by the health insurance company’s premiums. ï‚· Complaints Upheld by DFS: Number of closed complaints resolved in favor of the member or provider because DFS determined that the health insurance company did not comply with statutory or contractual obligations. Complaints upheld by DFS are used to calculate the complaint ratio and ranking. ï‚· Total Complaints to DOH: Total number of complaints closed by DOH. Complaints to DOH involve concerns about the quality of care received by members. ï‚· Complaints Upheld by DOH: Number of complaints closed by DOH that were decided in favor of the member or provider.
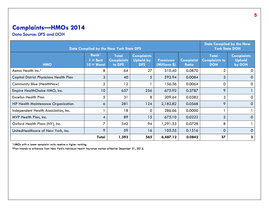
6) 5 Complaints—HMOs 2014 Data Source: DFS and DOH Data Compiled by the New York State DOH Data Compiled by the New York State DFS HMO Aetna Health Inc.2 Rank1 Total 1 = Best Complaints 10 = Worst to DFS 8 64 Complaints Upheld by DFS 27 Total Premiums Complaint Complaints to (Millions $) Ratio DOH 310.40 0.0870 2 Complaints Upheld by DOH 0 Capital District Physicians Health Plan 3 40 5 592.94 0.0084 3 0 Community Blue (HealthNow) 2 12 1 156.56 0.0064 0 0 10 657 256 675.92 0.3787 9 1 Excellus Health Plan 5 31 8 209.64 0.0382 3 0 HIP Health Maintenance Organization 6 281 124 2,182.82 0.0568 9 0 Independent Health Association, Inc. 1 18 0 286.66 0.0000 1 1 MVP Health Plan, Inc. 4 89 15 675.10 0.0222 2 0 Oxford Health Plans (NY), Inc. 7 342 94 1,291.53 0.0728 8 1 UnitedHealthcare of New York, Inc. 9 59 16 105.55 0.1516 0 0 Total 1,593 565 6,487.12 0.0842 37 3 Empire HealthChoice HMO, Inc. 1HMOs 2Plan with a lower complaint ratio receive a higher ranking. intends to withdraw from New York’s individual health insurance market effective December 31, 2015.
7) 6 Complaints—EPO/PPO Health Plans1 2014 Data Source: DFS EPO/PPO Health Plan Rank2,3 Total Complaints Premiums 1 = Best Complaints Upheld 12 = Worst to DFS by DFS (Millions $) Complaint Ratio CDPHP Universal Benefits, Inc.4 3 18 5 688.25 0.0073 Empire HealthChoice Assurance, Inc.4 9 712 152 2,048.57 0.0742 5 10 12 4 11 1 6 2 7 8 Total 258 363 348 49 29 1 32 15 608 196 2,629 70 148 214 10 18 0 8 0 158 60 843 3,764.46 1,504.52 545.98 1,355.00 60.72 476.76 353.28 60.93 5,691.62 1,971.91 18,522.01 0.0186 0.0984 0.3920 0.0074 0.2964 0.0000 0.0226 0.0000 0.0278 0.0304 0.0455 Excellus Health Plan, Inc.4 Group Health Incorporated3 Health Republic Insurance of New York, Corp. HealthNow New York Inc.4 HIP Insurance Company of New York4 Independent Health Benefits Corporation MVP Health Insurance Company4 Oscar Insurance Corporation Oxford Health Insurance, Inc.4 UnitedHealthcare Insurance Company of New York4 1The non-profit indemnity category was removed and replaced with an EPO/PPO category to better reflect the types of policies currently being issued. The EPO/PPO category includes plans previously in the non-profit indemnity category and some plans previously in the commercial category that offer an EPO or PPO product. 2If the ratios are the same among health insurance companies, the health insurance company with the higher annual premium amount receives a higher ranking. 3Health insurance companies with a lower complaint ratio receive a higher ranking. 4Complaints, complaint ratios, and premiums include data from the health insurance company's EPO, PPO and commercial business.
8) 7 Complaints—Commercial Health Insurance Companies 2014 Data Source: DFS Commercial Health Insurance Company Rank1,2 1 = Best 35 = Worst Total Complaints Complaints Upheld to DFS by DFS Premiums (Millions $) Complaint Ratio Aetna Life Insurance Company3,4 American Family Life Assurance Company of New York American Progressive Life and Health Insurance BCS Insurance Company Berkshire Life Insurance Company of America CIGNA Health and Life Insurance Company3 CIGNA Life Insurance Company of New York Combined Life Insurance Company of New York Delta Dental of New York, Inc.5 32 19 24 28 11 31 6 33 23 250 11 9 1 1 76 6 26 7 88 2 4 1 0 37 0 5 2 2,425.38 275.95 302.86 54.64 68.03 1,132.06 87.63 109.03 154.97 0.0363 0.0072 0.0132 0.0183 0.0000 0.0327 0.0000 0.0459 0.0129 Dentcare Delivery Systems, Inc.5 Eastern Vision Service Plan, Inc.6 First Unum Life Insurance Company Genworth Life Insurance Company of New York Guardian Life Insurance Company of America Hartford Life Insurance Company HM Life Insurance Company of New York John Hancock Life & Health Insurance Company Liberty Life Assurance Company of Boston 13 8 18 26 20 2 10 34 17 9 0 24 11 23 4 0 23 1 0 0 1 3 3 0 0 6 0 54.84 86.92 265.89 184.85 372.36 105.06 74.30 125.16 50.20 0.0000 0.0000 0.0038 0.0162 0.0081 0.0000 0.0000 0.0479 0.0000 1If the ratios are the same among health insurance companies, the health insurance company with the higher annual premium amount receives a higher ranking. insurance companies with a lower complaint ratio receive a higher ranking. 3Complaints, complaint ratios, and premiums include data from the health insurance company's EPO, PPO and commercial business. 4Plan intends to withdraw from New York’s individual health insurance market effective December 31, 2015. 5Plan issues dental coverage only. 6Plan issues vision coverage only. 2Health
9) 8 Complaints—Commercial Health Insurance Companies 2014 Data Source: DFS Commercial Health Insurance Company Lincoln Life & Annuity Company of New York Massachusetts Mutual Life Insurance Company Metropolitan Life Insurance Company MVP Health Services Corporation3 National Union Fire Insurance Company of Pittsburgh, PA New York Life Insurance Company Nippon Life Insurance Company of America Northwestern Mutual Life Insurance Company Paul Revere Life Insurance Company Principal Life Insurance Company Prudential Insurance Company of America ShelterPoint Life Insurance Company Standard Life Insurance Company of New York Standard Security Life Insurance Company of New York Sun Life and Health Insurance Company Transamerica Financial Life Insurance Company United States Fire Insurance Company 1If Rank1,2 1 = Best 35 = Worst 15 22 21 3 4 25 30 7 14 27 1 9 29 12 5 35 16 Total Total Complaints Complaints Upheld to DFS by DFS 8 4 42 0 4 7 7 4 2 3 9 2 1 2 1 23 4 605 Premiums (Millions $) 0 1 7 0 0 1 2 0 0 1 0 0 1 0 0 7 0 172 ratios are the same among health insurance companies, the health insurance company with the higher annual premium amount receives a higher ranking. insurance companies with a lower complaint ratio receive a higher ranking. 3Plan issues dental coverage only. 2Health 52.66 77.91 581.52 101.52 99.99 71.91 79.45 87.06 54.68 60.73 123.18 83.79 54.18 66.96 92.93 109.25 52.09 7,779.91 Complaint Ratio 0.0000 0.0128 0.0120 0.0000 0.0000 0.0139 0.0252 0.0000 0.0000 0.0165 0.0000 0.0000 0.0185 0.0000 0.0000 0.0641 0.0000 0.0221
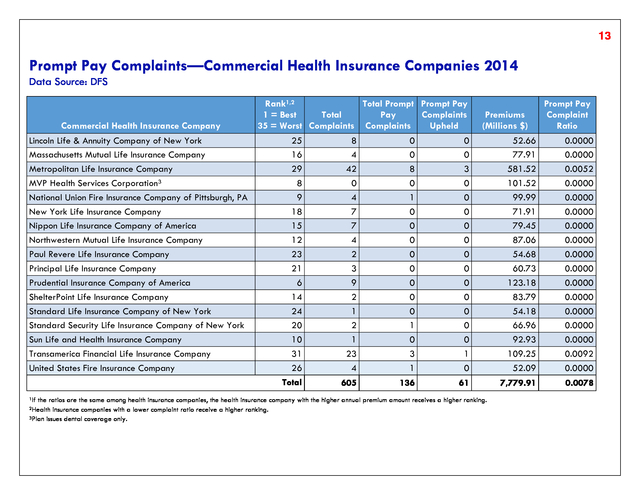
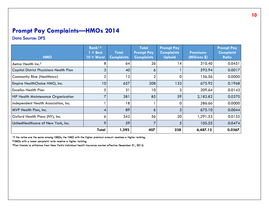
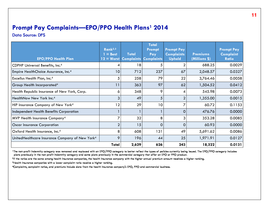
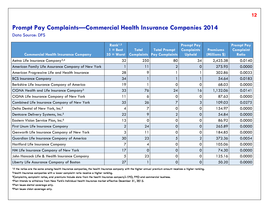
10) 9 Prompt Pay Complaints New York State requires all health insurance companies to: ï‚· Pay undisputed electronic claims within 30 days and pay undisputed paper claims within 45 days of receipt, or ï‚· Request all additional information from the member or the provider, if necessary, within 30 days of receipt of the claim, or ï‚· Deny the claim within 30 days of receipt. For issues concerning payment, reimbursement, coverage, benefits, rates and premiums, contact DFS at: www.dfs.ny.gov/consumer/fileacomplaint.htm or call 800-342-3736. UNDERSTANDING THE CHARTS ï‚· Rank: Each health insurance company’s rank is based on the number of prompt pay complaints upheld, relative to the company’s premiums. A lower number results in a higher ranking. If the ratios are the same, the health insurance company with the higher premiums is ranked higher. ï‚· Prompt Pay Complaints Upheld: Number of closed prompt pay complaints where DFS determined that the health insurance company was not processing claims in a timely manner. Prompt pay complaints upheld by DFS are used to calculate the prompt pay complaint ratio and ranking. ï‚· Total Complaints: Total number of complaints closed by DFS in 2014. Complaints typically involve issues about prompt payment, reimbursement, coverage, benefits, rates and premiums. ï‚· Premiums: Dollar amount generated by a health insurance company in New York State in 2014. Premiums are used to calculate the prompt pay complaint ratio so that health insurance companies of different sizes can be compared fairly. Premium data exclude Medicare and Medicaid. ï‚· Total Prompt Pay Complaints: Total number of prompt pay complaints closed by DFS in 2014. Large health insurance companies may receive more complaints because they have more members and pay more claims than smaller health insurance companies. ï‚· Prompt Pay Complaint Ratio: Number of prompt pay complaints upheld divided by a health insurance company’s premiums.
11) 10 Prompt Pay Complaints—HMOs 2014 Data Source: DFS HMO Rank1,2 1 = Best 10 = Worst Total Complaints Total Prompt Pay Complaints Prompt Pay Complaints Upheld Premiums (Millions $) Prompt Pay Complaint Ratio Aetna Health Inc.3 Capital District Physicians Health Plan 8 64 26 14 310.40 0.0451 3 40 6 1 592.94 0.0017 Community Blue (Healthnow) 2 12 2 0 156.56 0.0000 10 657 208 133 675.92 0.1968 Excellus Health Plan 5 31 10 3 209.64 0.0143 HIP Health Maintenance Organization 7 281 85 59 2,182.82 0.0270 Independent Health Association, Inc. 1 18 1 0 286.66 0.0000 MVP Health Plan, Inc. 4 89 6 3 675.10 0.0044 Oxford Health Plans (NY), Inc. 6 342 56 20 1,291.53 0.0155 UnitedHealthcare of New York, Inc. 9 59 7 5 105.55 0.0474 Total 1,593 407 238 6,487.12 0.0367 Empire HealthChoice HMO, Inc. 1If the ratios are the same among HMOs, the HMO with the higher premium amount receives a higher ranking. with a lower complaint ratio receive a higher ranking. 3Plan intends to withdraw from New York’s individual health insurance market effective December 31, 2015. 2HMOs
12) 11 Prompt Pay Complaints—EPO/PPO Health Plans1 2014 Data Source: DFS Total Prompt Prompt Pay Total 1 = Best Pay Complaints 12 = Worst Complaints Complaints Upheld Rank2,3 EPO/PPO Health Plan Premiums (Millions $) Prompt Pay Complaint Ratio 4 18 5 2 688.25 0.0029 10 712 237 67 2,048.57 0.0327 5 258 79 22 3,764.46 0.0058 11 363 97 62 1,504.52 0.0412 Health Republic Insurance of New York, Corp. 6 348 9 4 545.98 0.0073 HealthNow New York Inc.4 3 49 5 2 1,355.00 0.0015 12 29 10 7 60.72 0.1153 Independent Health Benefits Corporation 1 1 1 0 476.76 0.0000 MVP Health Insurance Company4 7 32 8 3 353.28 0.0085 Oscar Insurance Corporation 2 15 0 0 60.93 0.0000 Oxford Health Insurance, Inc.4 8 608 131 49 5,691.62 0.0086 UnitedHealthcare Insurance Company of New York4 9 196 44 25 1,971.91 0.0127 Total 2,629 626 243 18,522 0.0131 CDPHP Universal Benefits, Inc.4 Empire HealthChoice Assurance, Inc.4 Excellus Health Plan, Inc.4 Group Health Incorporated4 HIP Insurance Company of New York4 1The non-profit indemnity category was removed and replaced with an EPO/PPO category to better reflect the types of policies currently being issued. The EPO/PPO category includes plans previously in the non-profit indemnity category and some plans previously in the commercial category that offer an EPO or PPO product. 2If the ratios are the same among health insurance companies, the health insurance company with the higher annual premium amount receives a higher ranking. 3Health insurance companies with a lower complaint ratio receive a higher ranking. 4Complaints, complaint ratios, and premiums include data from the health insurance company's EPO, PPO and commercial business.
13) 12 Prompt Pay Complaints—Commercial Health Insurance Companies 2014 Data Source: DFS Commercial Health Insurance Company Aetna Life Insurance Company3,4 American Family Life Assurance Company of New York American Progressive Life and Health Insurance BCS Insurance Company Berkshire Life Insurance Company of America CIGNA Health and Life Insurance Company3 CIGNA Life Insurance Company of New York Combined Life Insurance Company of New York Delta Dental of New York, Inc.5 Dentcare Delivery Systems, Inc.5 Eastern Vision Service Plan, Inc.6 First Unum Life Insurance Company Genworth Life Insurance Company of New York Guardian Life Insurance Company of America Hartford Life Insurance Company HM Life Insurance Company of New York John Hancock Life & Health Insurance Company Liberty Life Assurance Company of Boston 1If Rank1,2 Prompt Pay Total Total Prompt Complaints 1 = Best 35 = Worst Complaints Pay Complaints Upheld 32 1 28 34 19 33 11 35 4 22 13 2 3 30 7 17 5 27 250 11 9 1 1 76 6 26 7 9 0 24 11 23 4 0 23 1 80 2 1 1 0 24 0 7 0 2 0 0 0 5 0 0 0 0 34 0 1 1 0 16 0 3 0 0 0 0 0 2 0 0 0 0 the ratios are the same among health insurance companies, the health insurance company with the higher annual premium amount receives a higher ranking. insurance companies with a lower complaint ratio receive a higher ranking. 3Complaints, complaint ratios, and premiums include data from the health insurance company's EPO, PPO and commercial business. 4Plan intends to withdraw from New York’s individual health insurance market effective December 31, 2015. 5Plan issues dental coverage only. 6Plan issues vision coverage only. 2Health Premiums (Millions $) 2,425.38 275.95 302.86 54.64 68.03 1,132.06 87.63 109.03 154.97 54.84 86.92 265.89 184.85 372.36 105.06 74.30 125.16 50.20 Prompt Pay Complaint Ratio 0.0140 0.0000 0.0033 0.0183 0.0000 0.0141 0.0000 0.0275 0.0000 0.0000 0.0000 0.0000 0.0000 0.0054 0.0000 0.0000 0.0000 0.0000
14) 13 Prompt Pay Complaints—Commercial Health Insurance Companies 2014 Data Source: DFS Commercial Health Insurance Company Lincoln Life & Annuity Company of New York Massachusetts Mutual Life Insurance Company Metropolitan Life Insurance Company MVP Health Services Corporation3 National Union Fire Insurance Company of Pittsburgh, PA New York Life Insurance Company Nippon Life Insurance Company of America Northwestern Mutual Life Insurance Company Paul Revere Life Insurance Company Principal Life Insurance Company Prudential Insurance Company of America ShelterPoint Life Insurance Company Standard Life Insurance Company of New York Standard Security Life Insurance Company of New York Sun Life and Health Insurance Company Transamerica Financial Life Insurance Company United States Fire Insurance Company 1If Rank1,2 Total Prompt Prompt Pay Total 1 = Best Pay Complaints 35 = Worst Complaints Complaints Upheld 25 16 29 8 9 18 15 12 23 21 6 14 24 20 10 31 26 Total Premiums (Millions $) 8 4 42 0 4 7 7 4 2 3 9 2 1 2 1 23 4 0 0 8 0 1 0 0 0 0 0 0 0 0 1 0 3 1 0 0 3 0 0 0 0 0 0 0 0 0 0 0 0 1 0 52.66 77.91 581.52 101.52 99.99 71.91 79.45 87.06 54.68 60.73 123.18 83.79 54.18 66.96 92.93 109.25 52.09 0.0000 0.0000 0.0052 0.0000 0.0000 0.0000 0.0000 0.0000 0.0000 0.0000 0.0000 0.0000 0.0000 0.0000 0.0000 0.0092 0.0000 605 136 61 7,779.91 0.0078 the ratios are the same among health insurance companies, the health insurance company with the higher annual premium amount receives a higher ranking. insurance companies with a lower complaint ratio receive a higher ranking. 3Plan issues dental coverage only. 2Health Prompt Pay Complaint Ratio
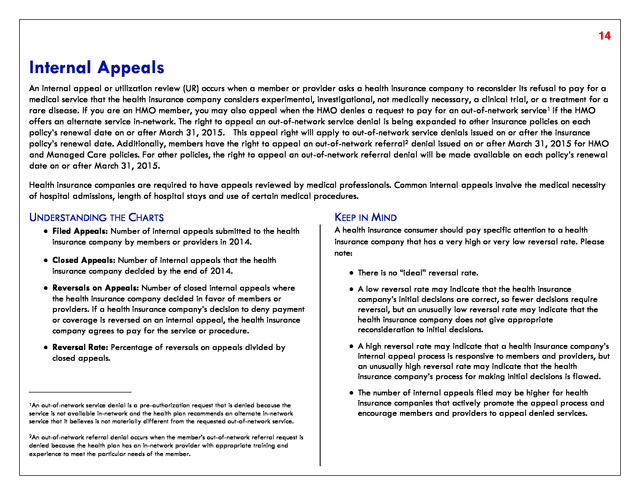
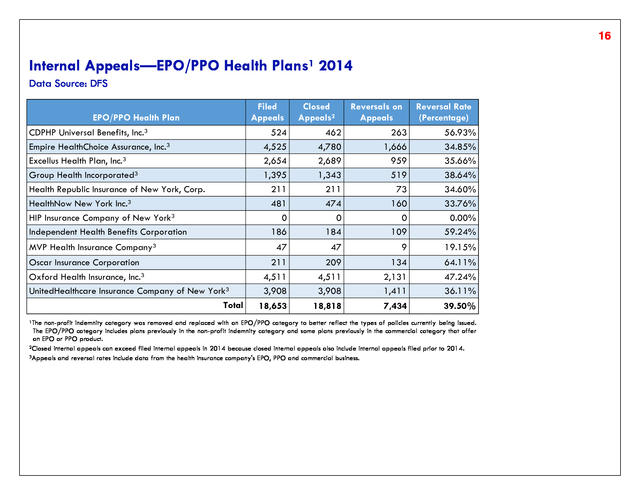
15) 14 Internal Appeals An internal appeal or utilization review (UR) occurs when a member or provider asks a health insurance company to reconsider its refusal to pay for a medical service that the health insurance company considers experimental, investigational, not medically necessary, a clinical trial, or a treatment for a rare disease. If you are an HMO member, you may also appeal when the HMO denies a request to pay for an out-of-network service1 if the HMO offers an alternate service in-network. The right to appeal an out-of-network service denial is being expanded to other insurance policies on each policy’s renewal date on or after March 31, 2015. This appeal right will apply to out-of-network service denials issued on or after the insurance policy’s renewal date. Additionally, members have the right to appeal an out-of-network referral2 denial issued on or after March 31, 2015 for HMO and Managed Care policies. For other policies, the right to appeal an out-of-network referral denial will be made available on each policy’s renewal date on or after March 31, 2015. Health insurance companies are required to have appeals reviewed by medical professionals. Common internal appeals involve the medical necessity of hospital admissions, length of hospital stays and use of certain medical procedures. UNDERSTANDING THE CHARTS ï‚· Filed Appeals: Number of internal appeals submitted to the health insurance company by members or providers in 2014. ï‚· Closed Appeals: Number of internal appeals that the health insurance company decided by the end of 2014. KEEP IN MIND A health insurance consumer should pay specific attention to a health insurance company that has a very high or very low reversal rate. Please note: ï‚· There is no “ideal” reversal rate. ï‚· Reversals on Appeals: Number of closed internal appeals where the health insurance company decided in favor of members or providers. If a health insurance company’s decision to deny payment or coverage is reversed on an internal appeal, the health insurance company agrees to pay for the service or procedure. ï‚· A low reversal rate may indicate that the health insurance company’s initial decisions are correct, so fewer decisions require reversal, but an unusually low reversal rate may indicate that the health insurance company does not give appropriate reconsideration to initial decisions. ï‚· Reversal Rate: Percentage of reversals on appeals divided by closed appeals. ï‚· A high reversal rate may indicate that a health insurance company’s internal appeal process is responsive to members and providers, but an unusually high reversal rate may indicate that the health insurance company’s process for making initial decisions is flawed. _______________________ 1An out-of-network service denial is a pre-authorization request that is denied because the service is not available in-network and the health plan recommends an alternate in-network service that it believes is not materially different from the requested out-of-network service. 2An out-of-network referral denial occurs when the member’s out-of-network referral request is denied because the health plan has an in-network provider with appropriate training and experience to meet the particular needs of the member. ï‚· The number of internal appeals filed may be higher for health insurance companies that actively promote the appeal process and encourage members and providers to appeal denied services.
16) 15 Internal Appeals—HMOs 2014 Data Source: DFS Filed Appeals HMO Aetna Health Inc.2 Capital District Physicians Health Plan Community Blue (Healthnow) Empire HealthChoice HMO, Inc. Excellus Health Plan HIP Health Maintenance Organization Independent Health Association, Inc. MVP Health Plan, Inc. Oxford Health Plans (NY), Inc. UnitedHealthcare of New York, Inc. 2Plan Reversals on Appeals Reversal Rate (Percentage) 221 172 79 1,364 69 678 99 78 1,582 344 Total 1Closed Closed Appeals1 216 169 78 1,926 70 678 100 75 925 347 91 37 25 670 25 277 52 12 47 84 42.13% 21.89% 32.05% 34.79% 35.71% 40.86% 52.00% 16.00% 5.08% 24.21% 4,686 4,584 1,320 28.80% internal appeals can exceed filed internal appeals in 2014 because closed internal appeals also include internal appeals filed prior to 2014. intends to withdraw from New York’s individual health insurance market effective December 31, 2015.
17) 16 Internal Appeals—EPO/PPO Health Plans1 2014 Data Source: DFS EPO/PPO Health Plan CDPHP Universal Benefits, Inc.3 Empire HealthChoice Assurance, Inc.3 Excellus Health Plan, Inc.3 Group Health Incorporated3 Health Republic Insurance of New York, Corp. HealthNow New York Inc.3 HIP Insurance Company of New York3 Independent Health Benefits Corporation MVP Health Insurance Company3 Oscar Insurance Corporation Oxford Health Insurance, Inc.3 UnitedHealthcare Insurance Company of New York3 Total 1The Filed Appeals Closed Appeals2 Reversals on Appeals Reversal Rate (Percentage) 524 4,525 2,654 1,395 211 481 0 186 462 4,780 2,689 1,343 211 474 0 184 263 1,666 959 519 73 160 0 109 56.93% 34.85% 35.66% 38.64% 34.60% 33.76% 0.00% 59.24% 47 47 9 19.15% 211 4,511 3,908 209 4,511 3,908 134 2,131 1,411 64.11% 47.24% 36.11% 18,653 18,818 7,434 39.50% non-profit indemnity category was removed and replaced with an EPO/PPO category to better reflect the types of policies currently being issued. The EPO/PPO category includes plans previously in the non-profit indemnity category and some plans previously in the commercial category that offer an EPO or PPO product. 2Closed internal appeals can exceed filed internal appeals in 2014 because closed internal appeals also include internal appeals filed prior to 2014. 3Appeals and reversal rates include data from the health insurance company's EPO, PPO and commercial business.
18) 17 Internal Appeals—Commercial Health Insurance Companies 2014 Data Source: DFS Commercial Health Insurance Company1 Aetna Life Insurance Company3,4 American Family Life Assurance Company of New York American Progressive Life and Health Insurance BCS Insurance Company Berkshire Life Insurance Company of America CIGNA Health and Life Insurance Company3 CIGNA Life Insurance Company of New York Combined Life Insurance Company of New York Delta Dental of New York, Inc.5 Dentcare Delivery Systems, Inc.5 Eastern Vision Service Plan, Inc.6 First Unum Life Insurance Company Genworth Life Insurance Company of New York Guardian Life Insurance Company of America Hartford Life Insurance Company HM Life Insurance Company of New York 1Many Filed Appeals 2,416 0 0 0 0 2,514 0 0 0 0 0 0 0 4,531 0 0 Closed Appeals2 2,373 0 0 0 0 2,502 0 0 0 0 0 0 0 4,568 0 0 Reversals on Appeals 915 0 0 0 0 763 0 0 0 0 0 0 0 3,022 0 0 commercial health insurance companies do not write traditional comprehensive health insurance products and therefore have no internal appeals. internal appeals can exceed filed internal appeals in 2014 because closed internal appeals also include internal appeals filed prior to 2014. 3Appeals and reversal rates include data from the health insurance company's EPO, PPO and commercial business. 4Plan intends to withdraw from New York’s individual health insurance market effective December 31, 2015. 5Plan issues dental coverage only. 6Plan issues vision coverage only. 2Closed Reversal Rate (Percentage) 38.56% 0.00% 0.00% 0.00% 0.00% 30.50% 0.00% 0.00% 0.00% 0.00% 0.00% 0.00% 0.00% 66.16% 0.00% 0.00%
19) 18 Internal Appeals—Commercial Health Insurance Companies 2014 Data Source: DFS Commercial Health Insurance Company1 John Hancock Life & Health Insurance Company Liberty Life Assurance Company of Boston Lincoln Life & Annuity Company of New York Massachusetts Mutual Life Insurance Company Metropolitan Life Insurance Company MVP Health Services Corporation3 National Union Fire Insurance Company of Pittsburgh, PA New York Life Insurance Company Nippon Life Insurance Company of America Northwestern Mutual Life Insurance Company Paul Revere Life Insurance Company Principal Life Insurance Company Prudential Insurance Company of America ShelterPoint Life Insurance Company Standard Life Insurance Company of New York Standard Security Life Insurance Company of New York Sun Life and Health Insurance Company Transamerica Financial Life Insurance Company United States Fire Insurance Company Total 1Many Filed Appeals Closed Appeals2 Reversals on Appeals 0 0 0 0 12,028 23 0 0 360 0 0 7 3 0 23 0 33 0 0 0 0 0 0 12,028 23 0 0 352 0 0 7 3 0 22 0 33 0 0 0 0 0 0 10,215 5 0 0 101 0 0 1 0 0 10 0 9 0 0 0.00% 0.00% 0.00% 0.00% 84.93% 21.74% 0.00% 0.00% 28.69% 0.00% 0.00% 14.29% 0.00% 0.00% 45.45% 0.00% 27.27% 0.00% 0.00% 21,938 21,911 15,041 68.65% commercial health insurance companies do not write traditional comprehensive health insurance products and therefore have no internal appeals. internal appeals can exceed filed internal appeals in 2014 because closed internal appeals also include internal appeals filed prior to 2014. 3Plan issues dental coverage only. 2Closed Reversal Rate (Percentage)
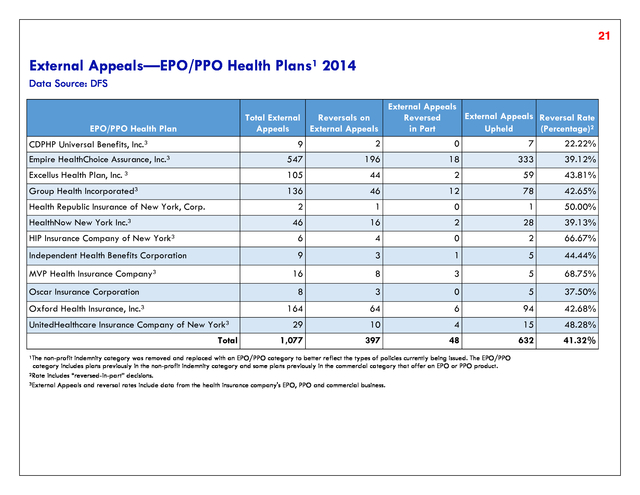
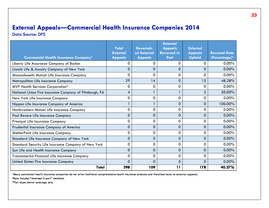
20) 19 External Appeals After an internal appeal, members and providers may request an external appeal when a health insurance company continues to refuse to pay for/provide reimbursement for health care services on the basis that services are experimental, investigational, not medically necessary, a clinical trial, or a treatment for a rare disease. If you are an HMO member, you may also appeal when the HMO denies a request to pay for an out-of-network service1 if the HMO offers an alternate service in-network. The right to appeal an out-of-network service denial is being expanded to other insurance policies on each policy’s renewal date on or after March 31, 2015. This appeal right will apply to out-of-network service denials issued on or after the insurance policy’s renewal date. Additionally, members have the right to appeal an out-of-network referral2 denial issued on or after March 31, 2015 for HMO and Managed Care policies. For other policies, the right to appeal an out-of-network referral denial will be made available on each policy’s renewal date on or after March 31, 2015. Before requesting an external appeal, you usually must complete the health insurance company’s first-level internal appeal process, or you and your health insurance company may agree jointly to waive the internal appeal process. *Providers may file external appeals on their own behalves for continued or extended health care services; additional services for a patient undergoing a course of continued treatment; or services already provided. UNDERSTANDING THE CHARTS ï‚· Total External Appeals: Total number of cases assigned to an external appeal organization in 2014. ï‚· Reversals on External Appeals: Number of cases where an external appeal organization decided in favor of the member or provider. ï‚· External Appeals Reversed in Part: Number of cases where an external appeal organization decided partially in favor of the member or provider. For example, an HMO refuses payment of a 5-day hospital stay, claiming it was not medically necessary; however, the external appeal organization decides that 3 of the 5 days were medically necessary. ï‚· External Appeals Upheld: Number of cases where an external appeal organization agreed with the health insurance company’s decision not to cover a service or procedure. ï‚· Reversal Rate: Percentage of reversals on external appeals (cases decided in favor of the member or provider) divided by total external appeals. Please note that the number of cases when an external appeal organization decided partially in favor of the member or provider is also included in the reversal rate. A high reversal rate may indicate that a health insurance company does not make appropriate coverage decisions. 1An out-of-network service denial is a pre-authorization request that is denied because the service is not available in-network and the health plan recommends an alternate in-network service that it believes is not materially different from the requested out-of-network service. 2An out-of-network referral denial occurs when the member’s out-of-network referral request is denied because the health plan has an in-network provider with appropriate training and experience to meet the particular needs of the member.
21) 20 External Appeals—HMOs 2014 Data Source: DFS Total External Appeals HMO Aetna Health Inc.2 External Appeals Reversed in Part Reversals on External Appeals External Appeals Upheld Reversal Rate (Percentage)1 24 2 2 20 16.67% Capital District Physicians Health Plan 19 7 0 12 36.84% Community Blue (HealthNow) Empire HealthChoice HMO, Inc. Excellus Health Plan HIP Health Maintenance Organization Independent Health Association, Inc. MVP Health Plan, Inc. Oxford Health Plans (NY), Inc. UnitedHealthcare of New York, Inc. 2 158 19 111 7 15 56 0 411 1 46 10 28 3 5 27 0 129 0 7 1 7 0 1 2 0 20 1 105 8 76 4 9 27 0 262 50.00% 33.54% 57.89% 31.53% 42.86% 40.00% 51.79% 0.00% 36.25% Total 1Rate 2Plan includes “reversed-in-part” decisions. intends to withdraw from New York’s individual health insurance market effective December 31, 2015.
22) 21 External Appeals—EPO/PPO Health Plans1 2014 Data Source: DFS External Appeals External Appeals Reversal Rate Total External Reversals on Reversed Appeals External Appeals in Part Upheld (Percentage)2 EPO/PPO Health Plan 9 2 0 7 22.22% Empire HealthChoice Assurance, Inc.3 547 196 18 333 39.12% Excellus Health Plan, Inc. 3 105 44 2 59 43.81% Group Health Incorporated3 136 46 12 78 42.65% 2 1 0 1 50.00% 46 16 2 28 39.13% HIP Insurance Company of New York3 6 4 0 2 66.67% Independent Health Benefits Corporation 9 3 1 5 44.44% 16 8 3 5 68.75% 8 3 0 5 37.50% 164 64 6 94 42.68% 29 10 4 15 48.28% 1,077 397 48 632 41.32% CDPHP Universal Benefits, Inc.3 Health Republic Insurance of New York, Corp. HealthNow New York Inc.3 MVP Health Insurance Company3 Oscar Insurance Corporation Oxford Health Insurance, Inc.3 UnitedHealthcare Insurance Company of New York3 Total 1The non-profit indemnity category was removed and replaced with an EPO/PPO category to better reflect the types of policies currently being issued. The EPO/PPO category includes plans previously in the non-profit indemnity category and some plans previously in the commercial category that offer an EPO or PPO product. 2Rate includes “reversed-in-part” decisions. 3External Appeals and reversal rates include data from the health insurance company's EPO, PPO and commercial business.
23) 22 External Appeals—Commercial Health Insurance Companies 2014 Data Source: DFS Commercial Health Insurance Company1 Aetna Life Insurance Company3,4 American Family Life Assurance Company of New York American Progressive Life and Health Insurance BCS Insurance Company Berkshire Life Insurance Company of America CIGNA Health and Life Insurance Company3 CIGNA Life Insurance Company of New York Combined Life Insurance Company of New York Delta Dental of New York, Inc.5 Dentcare Delivery Systems, Inc.5 Eastern Vision Service Plan, Inc.6 First Unum Life Insurance Company Genworth Life Insurance Company of New York Guardian Life Insurance Company of America Hartford Life Insurance Company HM Life Insurance Company of New York John Hancock Life & Health Insurance Company 1Many Total External Appeals 173 0 0 0 0 81 0 0 0 0 0 0 0 10 0 0 0 Reversals on External Appeals 59 0 0 0 0 27 0 0 0 0 0 0 0 7 0 0 0 External Appeals Reversed in Part External Appeals Upheld 6 0 0 0 0 3 0 0 0 0 0 0 0 1 0 0 0 commercial health insurance companies do not write traditional comprehensive health insurance products and therefore have no external appeals. includes “reversed-in-part” decisions. 3External Appeals and reversal rates include data from the health insurance company's EPO, PPO and commercial business. 4Plan intends to withdraw from New York’s individual health insurance market effective December 31, 2015. 5Plan issues dental coverage only. 6Plan issues vision coverage only. 2Rate 108 0 0 0 0 51 0 0 0 0 0 0 0 2 0 0 0 Reversal Rate (Percentage)2 37.57% 0.00% 0.00% 0.00% 0.00% 37.04% 0.00% 0.00% 0.00% 0.00% 0.00% 0.00% 0.00% 80.00% 0.00% 0.00% 0.00%
24) 23 External Appeals—Commercial Health Insurance Companies 2014 Data Source: DFS Company1 Commercial Health Insurance Liberty Life Assurance Company of Boston Lincoln Life & Annuity Company of New York Massachusetts Mutual Life Insurance Company Metropolitan Life Insurance Company MVP Health Services Corporation3 National Union Fire Insurance Company of Pittsburgh, PA New York Life Insurance Company Nippon Life Insurance Company of America Northwestern Mutual Life Insurance Company Paul Revere Life Insurance Company Principal Life Insurance Company Prudential Insurance Company of America ShelterPoint Life Insurance Company Standard Life Insurance Company of New York Standard Security Life Insurance Company of New York Sun Life and Health Insurance Company Transamerica Financial Life Insurance Company United States Fire Insurance Company Total 1Many Total External Appeals 0 0 0 29 0 4 0 1 0 0 0 0 0 0 0 0 0 0 298 Reversals on External Appeals 0 0 0 14 0 1 0 1 0 0 0 0 0 0 0 0 0 0 109 External Appeals Reversed in Part 0 0 0 0 0 1 0 0 0 0 0 0 0 0 0 0 0 0 11 External Appeals Upheld commercial health insurance companies do not write traditional comprehensive health insurance products and therefore have no external appeals. includes “reversed-in-part” decisions. 3Plan issues dental coverage only. 2Rate 0 0 0 15 0 2 0 0 0 0 0 0 0 0 0 0 0 0 178 Reversal Rate (Percentage)2 0.00% 0.00% 0.00% 48.28% 0.00% 50.00% 0.00% 100.00% 0.00% 0.00% 0.00% 0.00% 0.00% 0.00% 0.00% 0.00% 0.00% 0.00% 40.27%
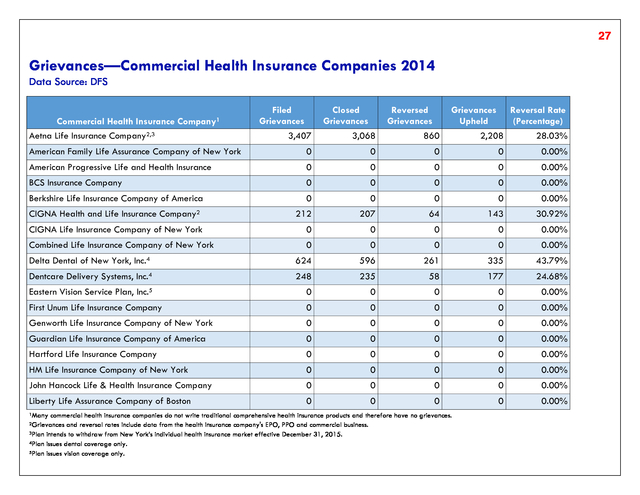
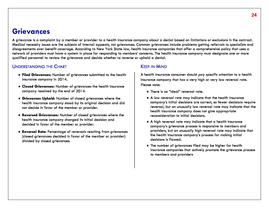
25) 24 Grievances A grievance is a complaint by a member or provider to a health insurance company about a denial based on limitations or exclusions in the contract. Medical necessity issues are the subjects of internal appeals, not grievances. Common grievances include problems getting referrals to specialists and disagreements over benefit coverage. According to New York State law, health insurance companies that offer a comprehensive policy that uses a network of providers must have a system in place for responding to members’ concerns. The health insurance company must designate one or more qualified personnel to review the grievance and decide whether to reverse or uphold a denial. UNDERSTANDING THE CHART ï‚· Filed Grievances: Number of grievances submitted to the health insurance company in 2014. ï‚· Closed Grievances: Number of grievances the health insurance company resolved by the end of 2014. ï‚· Grievances Upheld: Number of closed grievances where the health insurance company stood by its original decision and did not decide in favor of the member or provider. ï‚· Reversed Grievances: Number of closed grievances where the health insurance company changed its initial decision and decided in favor of the member or provider. ï‚· Reversal Rate: Percentage of reversals resulting from grievances (closed grievances decided in favor of the member or provider) divided by closed grievances. KEEP IN MIND A health insurance consumer should pay specific attention to a health insurance company that has a very high or very low reversal rate. Please note: ï‚· There is no “ideal” reversal rate. ï‚· A low reversal rate may indicate that the health insurance company’s initial decisions are correct, so fewer decisions require reversal, but an unusually low reversal rate may indicate that the health insurance company does not give appropriate reconsideration to initial decisions. ï‚· A high reversal rate may indicate that a health insurance company’s grievance process is responsive to members and providers, but an unusually high reversal rate may indicate that the health insurance company’s process for making initial decisions is flawed. ï‚· The number of grievances filed may be higher for health insurance companies that actively promote the grievance process to members and providers
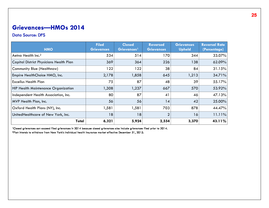
26) 25 Grievances—HMOs 2014 Data Source: DFS Filed Grievances 534 Closed Grievances1 514 Reversed Grievances 170 Capital District Physicians Health Plan 369 364 226 138 62.09% Community Blue (Healthnow) 122 122 38 84 31.15% 2,178 1,858 645 1,213 34.71% 75 87 48 39 55.17% 1,308 1,237 667 570 53.92% Independent Health Association, Inc. 80 87 41 46 47.13% MVP Health Plan, Inc. 56 56 14 42 25.00% 1,581 1,581 703 878 44.47% 18 18 2 16 11.11% 6,321 5,924 2,554 3,370 43.11% HMO Aetna Health Inc.2 Empire HealthChoice HMO, Inc. Excellus Health Plan HIP Health Maintenance Organization Oxford Health Plans (NY), Inc. UnitedHealthcare of New York, Inc. Total 1Closed 2Plan grievances can exceed filed grievances in 2014 because closed grievances also include grievances filed prior to 2014. intends to withdraw from New York’s individual health insurance market effective December 31, 2015. Grievances Reversal Rate Upheld (Percentage) 344 33.07%
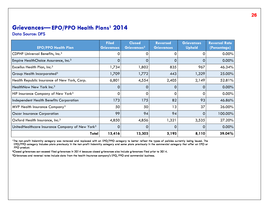
27) 26 Grievances— EPO/PPO Health Plans1 2014 Data Source: DFS Filed Grievances EPO/PPO Health Plan Closed Grievances2 Reversed Grievances Grievances Upheld Reversal Rate (Percentage) CDPHP Universal Benefits, Inc.3 0 0 0 0 0.00% Empire HealthChoice Assurance, Inc.3 0 0 0 0 0.00% Excellus Health Plan, Inc.3 1,734 1,802 835 967 46.34% Group Health Incorporated3 1,709 1,772 443 1,329 25.00% Health Republic Insurance of New York, Corp. 6,801 4,554 2,405 2,149 52.81% HealthNow New York Inc.3 0 0 0 0 0.00% HIP Insurance Company of New York3 0 0 0 0 0.00% 173 175 82 93 46.86% MVP Health Insurance Company3 50 50 13 37 26.00% Oscar Insurance Corporation 99 94 94 0 100.00% 4,850 4,856 1,321 3,535 27.20% 0 0 0 0 0.00% 15,416 13,303 5,193 8,110 39.04% Independent Health Benefits Corporation Oxford Health Insurance, Inc.3 UnitedHealthcare Insurance Company of New York3 Total 1The non-profit indemnity category was removed and replaced with an EPO/PPO category to better reflect the types of policies currently being issued. The EPO/PPO category includes plans previously in the non-profit indemnity category and some plans previously in the commercial category that offer an EPO or PPO product. 2Closed grievances can exceed filed grievances in 2014 because closed grievances also include grievances filed prior to 2014. 3Grievances and reversal rates include data from the health insurance company's EPO, PPO and commercial business.
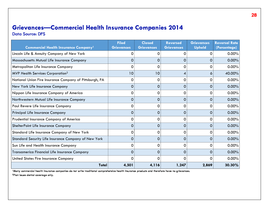
28) 27 Grievances—Commercial Health Insurance Companies 2014 Data Source: DFS Filed Grievances 3,407 Closed Grievances 3,068 Reversed Grievances 860 American Family Life Assurance Company of New York 0 0 0 0 0.00% American Progressive Life and Health Insurance 0 0 0 0 0.00% BCS Insurance Company 0 0 0 0 0.00% Berkshire Life Insurance Company of America 0 0 0 0 0.00% CIGNA Health and Life Insurance Company2 212 207 64 143 30.92% CIGNA Life Insurance Company of New York 0 0 0 0 0.00% Combined Life Insurance Company of New York 0 0 0 0 0.00% Delta Dental of New York, Inc.4 624 596 261 335 43.79% Dentcare Delivery Systems, Inc.4 248 235 58 177 24.68% Eastern Vision Service Plan, Inc.5 0 0 0 0 0.00% First Unum Life Insurance Company 0 0 0 0 0.00% Genworth Life Insurance Company of New York 0 0 0 0 0.00% Guardian Life Insurance Company of America 0 0 0 0 0.00% Hartford Life Insurance Company 0 0 0 0 0.00% HM Life Insurance Company of New York 0 0 0 0 0.00% John Hancock Life & Health Insurance Company 0 0 0 0 0.00% Liberty Life Assurance Company of Boston 0 0 0 0 0.00% Commercial Health Insurance Aetna Life Insurance Company2,3 1Many Company1 Grievances Reversal Rate Upheld (Percentage) 2,208 28.03% commercial health insurance companies do not write traditional comprehensive health insurance products and therefore have no grievances. and reversal rates include data from the health insurance company's EPO, PPO and commercial business. 3Plan intends to withdraw from New York’s individual health insurance market effective December 31, 2015. 4Plan issues dental coverage only. 5Plan issues vision coverage only. 2Grievances
29) 28 Grievances—Commercial Health Insurance Companies 2014 Data Source: DFS Filed Grievances 0 0 0 Reversal Rate (Percentage) 0 0.00% Massachusetts Mutual Life Insurance Company 0 0 0 0 0.00% Metropolitan Life Insurance Company 0 0 0 0 0.00% 10 10 4 6 40.00% National Union Fire Insurance Company of Pittsburgh, PA 0 0 0 0 0.00% New York Life Insurance Company 0 0 0 0 0.00% Nippon Life Insurance Company of America 0 0 0 0 0.00% Northwestern Mutual Life Insurance Company 0 0 0 0 0.00% Paul Revere Life Insurance Company 0 0 0 0 0.00% Principal Life Insurance Company 0 0 0 0 0.00% Prudential Insurance Company of America 0 0 0 0 0.00% ShelterPoint Life Insurance Company 0 0 0 0 0.00% Standard Life Insurance Company of New York 0 0 0 0 0.00% Standard Security Life Insurance Company of New York 0 0 0 0 0.00% Sun Life and Health Insurance Company 0 0 0 0 0.00% Transamerica Financial Life Insurance Company 0 0 0 0 0.00% United States Fire Insurance Company 0 0 0 0 0.00% 4,501 4,116 1,247 2,869 30.30% Commercial Health Insurance Company1 Lincoln Life & Annuity Company of New York MVP Health Services Corporation2 Total 1Many 2Plan Closed Grievances Reversed Grievances Grievances Upheld commercial health insurance companies do not write traditional comprehensive health insurance products and therefore have no grievances. issues dental coverage only.
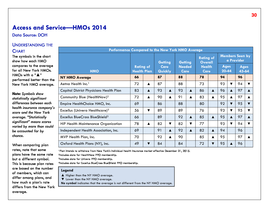
30) 29 Quality of Care and Service for Health Insurance Companies Access and Service MEASURE DESCRIPTIONS ï‚· Rating of Health Plan: The percentage of members who responded 8, 9 or 10 (on a scale of 0–10, where 0 is the worst health plan possible and 10 is the best health plan possible) when asked, “How would you rate your health plan?” ï‚· Rating of Overall Health Care: The percentage of members who responded 8, 9 or 10 (on a scale of 0–10, where 0 is the worst health care possible and 10 is the best health care possible) when asked, “How would you rate all your health care?” ï‚· Getting Care Quickly: The percentage of members who responded that they “usually” or always”: – Get appointments for regular or routine care as soon as requested. – Get care right away for an illness or injury. ï‚· Members Seen by a Provider: The percentage of adult health insurance members who had an outpatient or preventive care visit within the past 3 years, as reported by the health insurance company. A higher score means more people who were enrolled in the health insurance company had a provider visit. ï‚· Getting Needed Care: The percentage of members who responded that they “usually” or “always” thought it was easy to get: – Appointments with specialists. – Care, tests or treatments they thought they needed.
31) 30 Access and Service—HMOs 2014 Data Source: DOH UNDERSTANDING THE CHART The symbols in the chart show how each HMO compares to the average for all New York HMOs. HMOs with a “â–²” performed better than the New York HMO average. Note: Symbols show statistically significant differences between each health insurance company’s score and the New York average. “Statistically significant” means scores varied by more than could be accounted for by chance. When comparing plan rates, note that some plans have the same rate but a different symbol. This is because plan rates are based on the number of members, which can differ among plans, and how much a plan’s rate differs from the New York average. Performance Compared to the New York HMO Average HMO NY HMO Average Rating of Health Plan 66 Getting Needed Care 88 88 73 Members Seen by a Provider Ages Ages 20-44 45-64 94 96 93 Getting Care Quickly 87 Rating of Overall Health Care 78 â–¼ 94 â–¼ Aetna Health Inc.1 72 â–² 87 Capital District Physicians Health Plan 83 â–² 93 â–² 93 â–² 86 â–² 96 â–² 97 â–² Community Blue (HealthNow)2 72 â–² 90 â–² 91 â–² 83 â–² 95 â–² 97 â–² Empire HealthChoice HMO, Inc. 69 Excellus (Univera Healthcare)3 56 Excellus BlueCross BlueShield3 66 HIP Health Maintenance Organization 78 Independent Health Association, Inc. 86 80 92 â–¼ 95 â–¼ 89 89 76 93 â–¼ 95 â–¼ 89 â–¼ 88 92 â–² 85 95 â–² 97 â–² 93 â–¼ 94 â–¼ â–² 82 â–¼ 82 â–¼ 77 69 91 â–² 92 â–² 82 â–² 94 96 MVP Health Plan, Inc. 70 92 â–² 90 85 â–² 95 97 Oxford Health Plans (NY), Inc. 49 84 72 â–¼ 95 â–² â–¼ 84 1Plan intends to withdraw from New York’s individual health insurance market effective December 31, 2015. data for HealthNow PPO membership. 3Includes data for Univera PPO membership. 4Includes data for Excellus BlueCross BlueShield PPO membership. 2Includes Legend â–² Higher than the NY HMO average. â–¼ Lower than the NY HMO average. No symbol indicates that the average is not different from the NY HMO average. â–² 96 â–²
32) 31 Access and Service—PPOs 2014 Data Source: DOH UNDERSTANDING THE CHART The symbols in the chart show how each PPO compares to the average for all New York PPOs. PPOs with a “â–²” performed better than the New York PPO average. Note: Symbols show statistically significant differences between each health insurance company’s score and the New York average. “Statistically significant” means scores varied by more than could be accounted for by chance. When comparing plan rates, note that some plans have the same rate but a different symbol. This is because plan rates are based on the number of members, which can differ among plans, and how much a plan’s rate differs from the New York average. Performance Compared to the New York PPO Average Members Seen by a Provider Ages Ages 20-44 45-64 94 96 94 PPO1 NY PPO Average Rating of Health Plan 65 Getting Care Quickly 86 Getting Needed Care 86 Rating of Overall Health Care 77 Aetna Life Insurance Company2 58 â–¼ 81 â–¼ 80 â–¼ 70 CDPHP Universal Benefits, Inc. 70 â–² 90 â–² 92 â–² 79 95 Cigna Health and Life Insurance Company 62 86 86 79 94 Empire HealthChoice Assurance, Inc. 70 86 86 75 93 â–¼ 94 â–¼ Group Health Incorporated 66 85 87 77 93 â–¼ 94 â–¼ HIP Insurance Company of New York 70 â–² 77 â–¼ 77 â–¼ 75 92 â–¼ 94 â–¼ MVP Health Insurance Company 56 â–¼ 91 â–² 90 â–² 79 93 â–¼ 96 Oxford Health Insurance, Inc. 57 â–¼ 89 78 95 â–² 96 UnitedHealthcare Insurance Company of New York 71 â–² 92 79 94 1Data 2Plan 83 â–² 90 â–² for Excellus BlueCross BlueShield PPO, HealthNow PPO and for Univera PPO are included in the HMO tables. intends to withdraw from New York’s individual health insurance market effective December 31, 2015. Legend â–² Higher than the NY PPO average. â–¼ Lower than the NY PPO average. No symbol indicates that the average is not different from the NY PPO average. â–¼ 95 â–² 96 95 96
33) 32 Quality of Care and Service for Health Insurance Companies Child and Adolescent Health MEASURE DESCRIPTIONS ï‚· Childhood Immunization Status: The percentage of 2-year-olds who were fully immunized. “Fully immunized” means the 2-yearolds received the following vaccines: 4 diphtheria/tetanus/pertussis, 3 polio, 1 measles/mumps/rubella, 3 H influenza type B, 3 hepatitis B, 1 varicella and 4 pneumococcal. ï‚· Immunization for Adolescents: The percentage of 13-year-olds who had 1 dose of meningococcal vaccine between their 11th and 13th birthdays and 1 dose of tetanus, diphtheria and pertussis vaccine between their 10th and 13th birthdays. ï‚· Well-Child Visit in the First 15 Months of Life: The percentage of children who had 5 or more well-child and preventive health visits in their first 15 months of life. ï‚· Well-Child Visit During the 3rd, 4th, 5th and 6th Years: The percentage of children between the ages of 3 and 6 years who had well-child and preventive health visits in the past year. ï‚· Adolescent Well-Care Visits: The percentage of adolescents (ages 12–21) who had at least 1 well-care or preventive visit during the measurement year. ï‚· Medical Management for People With Asthma, 50% Days Covered (ages 5–18): The percentage of children 5–18 years with persistent asthma who filled prescriptions for asthma controller medications during at least 50% of their treatment period.
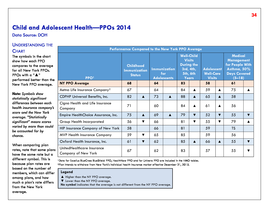
34) 33 Child and Adolescent Health—HMOs 2014 Data Source: DOH UNDERSTANDING THE CHART The symbols in the chart show how each HMO compares to the average for all New York HMOs. HMOs with a “â–²” performed better than the New York HMO average. Performance Compared to the New York HMO Average HMO NY HMO Average Well-Child Visits During the Childhood Immunization 3rd, 4th, Immunization for 5th, 6th Status Adolescents Years 74 72 85 Adolescent Well-Care Visits 61 Medical Management for People With Asthma, 50% Days Covered (ages 5–18) 57 When comparing plan rates, note that some plans have the same rate but a different symbol. This is because plan rates are based on the number of members, which can differ among plans, and how much a plan’s rate differs from the New York average. 62 â–¼ 68 82 â–¼ 59 â–¼ 71 Capital District Physicians Health Plan 81 â–² 74 90 â–² 69 â–² 58 Community Blue (HealthNow)2 80 â–² 75 88 â–² 66 â–² 54 Empire HealthChoice HMO, Inc. 62 â–¼ 70 79 â–¼ 50 â–¼ 57 Excellus (Univera Healthcare)3 84 â–² 74 87 64 â–² 39 â–¼ Excellus BlueCross BlueShield 86 â–² 72 85 61 59 â–² HIP Health Maintenance Organization 72 Independent Health Association, Inc. 84 MVP Health Plan, Inc. Note: Symbols show statistically significant differences between each health insurance company’s score and the New York average. “Statistically significant” means scores varied by more than could be accounted for by chance. Aetna Health Inc.1 78 Oxford Health Plans (NY), Inc. 58 â–² 78 â–² â–² 81 â–¼ 56 â–¼ 58 78 â–² 91 â–² 70 â–² 53 87 â–² 60 71 â–¼ 65 â–¼ 1Plan 85 intends to withdraw from New York’s individual health insurance market effective December 31, 2015. data for HealthNow PPO membership. 3Includes data for Univera PPO membership. 4Includes data for Excellus BlueCross BlueShield PPO membership. 2Includes Legend â–² Higher than the NY HMO average. â–¼ Lower than the NY HMO average. No symbol indicates that the average is not different from the NY HMO average. 64 61 â–² 53
35) 34 Child and Adolescent Health—PPOs 2014 Data Source: DOH UNDERSTANDING THE CHART The symbols in the chart show how each PPO compares to the average for all New York PPOs. PPOs with a “â–²” performed better than the New York PPO average. Note: Symbols show statistically significant differences between each health insurance company’s score and the New York average. “Statistically significant” means scores varied by more than could be accounted for by chance. When comparing plan rates, note that some plans have the same rate but a different symbol. This is because plan rates are based on the number of members, which can differ among plans, and how much a plan’s rate differs from the New York average. Performance Compared to the New York PPO Average PPO1 NY PPO Average Childhood Immunization Status 68 Immunization for Adolescents 64 Aetna Life Insurance Company2 67 CDPHP Universal Benefits, Inc. 82 Cigna Health and Life Insurance Company 71 Empire HealthChoice Assurance, Inc. 75 â–² 69 Group Health Incorporated 56 â–¼ HIP Insurance Company of New York 58 MVP Health Insurance Company 59 Oxford Health Insurance, Inc. 61 UnitedHealthcare Insurance Company of New York 67 1Data 2Plan 64 Well-Child Visits During the 3rd, 4th, 5th, 6th Years 83 Medical Management for People With Adolescent Asthma, 50% Well-Care Days Covered Visits (5–18) 58 61 84 â–² 59 â–² 75 88 â–² 65 â–² 58 84 â–² 61 â–² 56 79 â–¼ 52 â–¼ 55 â–¼ 66 81 â–¼ 55 â–¼ 79 â–² 66 81 59 TS â–¼ 65 85 59 56 â–¼ 62 85 62 83 â–² 73 â–² 60 â–² â–² for Excellus BlueCross BlueShield PPO, HealthNow PPO and for Univera PPO are included in the HMO tables. intends to withdraw from New York’s individual health insurance market effective December 31, 2015. Legend â–² Higher than the NY PPO average. â–¼ Lower than the NY PPO average. No symbol indicates that the average is not different from the NY PPO average. 66 57 â–² â–² 55 â–¼ 55 â–¼
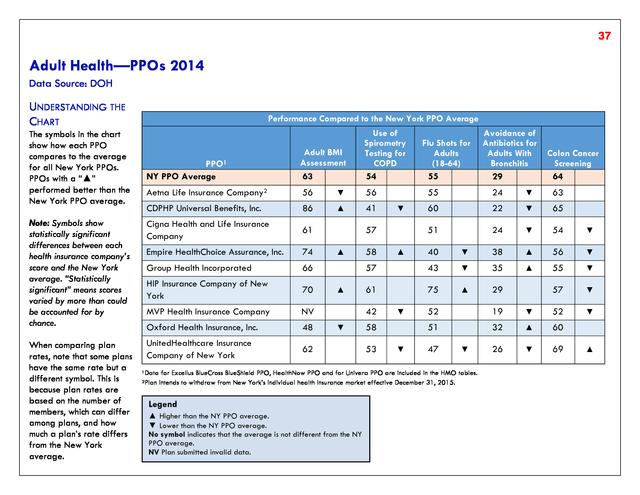
36) 35 Quality of Care and Service for Health Insurance Companies Adult Health MEASURE DESCRIPTIONS ï‚· Adult BMI Assessment: The percentage of members ages 18– 74 years who had an outpatient visit and had their body mass index (BMI) documented during the measurement year or the year prior the measurement year. ï‚· Avoidance of Antibiotics for Adults With Acute Bronchitis: The percentage of adults ages 18–64 years with acute bronchitis, who did not receive a prescription for antibiotics. A higher score indicates more appropriate treatment of people with acute bronchitis. ï‚· Use of Spirometry Testing for COPD: The percentage of members ages 40 years and older with a new diagnosis of COPD or newly active COPD, who received spirometry testing to confirm the diagnosis. ï‚· Colon Cancer Screening: The percentage of adults ages 50–75 years who had appropriate screening for colorectal cancer. ï‚· Flu Shot for Adults (18–64): The percentage of members ages 18–64 years who have had a flu shot.
37) 36 Adult Health—HMOs 2014 Data Source: DOH UNDERSTANDING THE CHART The symbols in the chart show how each HMO compares to the average for all New York HMOs. HMOs with a “â–²” performed better than the New York HMO average. Note: Symbols show statistically significant differences between each health insurance company’s score and the New York average. “Statistically significant” means scores varied by more than could be accounted for by chance. When comparing plan rates, note that some plans have the same rate but a different symbol. This is because plan rates are based on the number of members, which can differ among plans, and how much a plan’s rate differs from the New York average. Performance Compared to the New York HMO Average HMO NY HMO Average Adult BMI Assessment 78 Use of Spirometry Testing for COPD 52 Flu Shot for Adults (18–64) 49 Aetna Health Inc.1 61 â–¼ 64 â–² 48 Capital District Physicians Health Plan 92 â–² 42 â–¼ 55 Community Blue (HealthNow)2 82 â–² 51 Empire HealthChoice HMO, Inc. 77 Excellus (Univera Healthcare)3 87 â–² 45 Excellus BlueCross BlueShield4 82 â–² 41 HIP Health Maintenance Organization 86 â–² 57 Independent Health Association, Inc. 84 â–² 52 MVP Health Plan, Inc. 90 â–² 39 â–¼ 54 Oxford Health Plans (NY), Inc. 59 â–¼ 60 â–² 38 1Plan 61 Legend â–² Higher than the NY HMO average. â–¼ Lower than the NY HMO average. No symbol indicates that the average is not different from the NY HMO average. Colon Cancer Screening 64 26 â–² 66 21 76 50 18 â–¼ 47 37 â–² 54 51 17 â–¼ 59 â–¼ 53 17 â–¼ 64 â–² 40 â–¼ 30 â–² 66 55 â–² 18 â–¼ 65 18 â–¼ 67 31 â–² 60 â–² 66 â–² intends to withdraw from New York’s individual health insurance market effective December 31, 2015. data for HealthNow PPO membership. 3Includes data for Univera PPO membership. 4Includes data for Excellus BlueCross BlueShield PPO membership. 2Includes Avoidance of Antibiotics for Adults with Acute Bronchitis 24 â–¼ â–¼
38) 37 Adult Health—PPOs 2014 Data Source: DOH UNDERSTANDING THE CHART Performance Compared to the New York PPO Average NY PPO Average Adult BMI Assessment 63 Use of Spirometry Testing for COPD 54 Aetna Life Insurance Company2 56 â–¼ 56 CDPHP Universal Benefits, Inc. 86 â–² 41 Note: Symbols show statistically significant differences between each health insurance company’s score and the New York average. “Statistically significant” means scores varied by more than could be accounted for by chance. Cigna Health and Life Insurance Company 61 Empire HealthChoice Assurance, Inc. 74 Group Health Incorporated 66 HIP Insurance Company of New York 70 MVP Health Insurance Company NV Oxford Health Insurance, Inc. 48 When comparing plan rates, note that some plans have the same rate but a different symbol. This is because plan rates are based on the number of members, which can differ among plans, and how much a plan’s rate differs from the New York average. UnitedHealthcare Insurance Company of New York 62 The symbols in the chart show how each PPO compares to the average for all New York PPOs. PPOs with a “â–²” performed better than the New York PPO average. PPO1 1Data 2Plan Avoidance of Antibiotics for Adults With Bronchitis 29 Colon Cancer Screening 64 55 24 â–¼ 63 60 22 â–¼ 65 51 â–¼ 57 24 â–¼ 54 â–¼ â–² 40 â–¼ 38 â–² 56 â–¼ 57 â–² 58 Flu Shots for Adults (18-64) 55 43 â–¼ 35 â–² 55 â–¼ 61 75 â–² 29 57 â–¼ â–¼ 42 â–¼ â–² 58 53 â–¼ 52 19 â–¼ 52 51 â–¼ 32 â–² 60 26 â–¼ 69 47 â–¼ for Excellus BlueCross BlueShield PPO, HealthNow PPO and for Univera PPO are included in the HMO tables. intends to withdraw from New York’s individual health insurance market effective December 31, 2015. Legend â–² Higher than the NY PPO average. â–¼ Lower than the NY PPO average. No symbol indicates that the average is not different from the NY PPO average. NV Plan submitted invalid data. â–²
39) 38 Quality of Care and Service for Health Insurance Companies Women’s Health MEASURE DESCRIPTIONS ï‚· Breast Cancer Screening: The percentage of women ages 50–74 years who had a mammogram anytime on or between October 1, 2011 and December 31, 2013. ï‚· Timeliness of Prenatal Care: The percentage of women who gave birth in the last year who had a prenatal care visit in the first trimester or within 42 days of enrollment in their health plan. This measure was not collected in 2013; this report presents 2012 data. ï‚· Chlamydia Screening: The percentage of sexually active young women who had at least one test for chlamydia during the measurement year. The measure is reported separately for ages 16–20 years and for ages 21–24 years.
40) 39 Women’s Health—HMOs 2014 Data Source: DOH UNDERSTANDING THE CHART The symbols in the chart show how each HMO compares to the average for all New York HMOs. HMOs with a “â–²” performed better than the New York HMO average. Note: Symbols show statistically significant differences between each health insurance company’s score and the New York average. “Statistically significant” means scores varied by more than could be accounted for by chance. Performance Compared to the New York HMO Average Breast Timeliness Chlamydia Cancer of Prenatal Screening HMO Screening Care* (16–20) NY HMO Average 74 89 54 Chlamydia Screening (21–24) 61 Aetna Health Inc.1 68 â–¼ 91 Capital District Physicians Health Plan Community Blue (HealthNow)2 Empire HealthChoice HMO, Inc. Excellus (Univera Healthcare)3 Excellus BlueCross BlueShield4 HIP Health Maintenance Organization Independent Health Association, Inc. MVP Health Plan, Inc. Oxford Health Plans (NY), Inc. 79 73 67 74 76 76 76 73 69 â–² 96 82 89 90 96 83 97 94 90 â–¼ â–² â–² â–² â–¼ 60 â–² â–¼ â–² â–¼ â–² â–² 1Plan When comparing plan rates, note that some plans have the same rate but a different symbol. This is because plan rates are based on the number of members, which can differ among plans, and how much a plan’s rate differs from the New York average. intends to withdraw from New York’s individual health insurance market effective December 31, 2015. data for HealthNow PPO membership. 3Includes data for Univera PPO membership. 4Includes data for Excellus BlueCross BlueShield PPO membership. 2Includes Legend â–² Higher than the NY HMO average. â–¼ Lower than the NY HMO average. No symbol indicates that the average is not different from the NY HMO average. * Data are from 2012 as this is the most recent year the data was collected for this measure. â–² 67 â–² 60 58 59 52 43 76 54 50 54 â–² 68 62 65 57 52 77 60 60 63 â–² â–² â–² â–¼ â–² â–¼ â–² â–¼ â–¼ â–² â–²
41) 40 Women’s Health—PPOs 2014 Data Source: DOH UNDERSTANDING THE CHART The symbols in the chart show how each PPO compares to the average for all New York PPOs. PPOs with a “â–²” performed better than the New York PPO average. Note: Symbols show statistically significant differences between each health insurance company’s score and the New York average. “Statistically significant” means scores varied by more than could be accounted for by chance. When comparing plan rates, note that some plans have the same rate but a different symbol. This is because plan rates are based on the number of members, which can differ among plans, and how much a plan’s rate differs from the New York average. Performance Compared to the New York PPO Average PPO1 NY PPO Average Breast Cancer Screening 65 Timeliness of Prenatal Care* 90 Chlamydia Screening (16–20) 57 Chlamydia Screening (21–24) 66 55 65 Aetna Life Insurance Company2 69 â–² 91 CDPHP Universal Benefits, Inc. 75 â–² 96 â–² 58 66 Cigna Health and Life Insurance Company 70 â–² 94 â–² 56 66 Empire HealthChoice Assurance, Inc. 68 â–² 90 59 67 Group Health Incorporated 64 â–¼ 85 â–¼ 54 HIP Insurance Company of New York 70 â–² 85 â–¼ 57 MVP Health Insurance Company 73 â–² 62 â–¼ 50 â–¼ 60 â–¼ Oxford Health Insurance, Inc. 70 â–² 92 52 â–¼ 63 â–¼ UnitedHealthcare Insurance Company of New York 62 â–¼ 83 60 â–² 67 â–² 1Data 2Plan â–¼ for Excellus BlueCross BlueShield PPO, HealthNow PPO and for Univera PPO are included in the HMO tables. intends to withdraw from New York’s individual health insurance market effective December 31, 2015. Legend â–² Higher than the NY PPO average. â–¼ Lower than the NY PPO average. No symbol indicates that the average is not different from the NY PPO average. * Data are from 2012 as this is the most recent year the data was collected for this measure. â–¼ â–¼ â–² 64 68
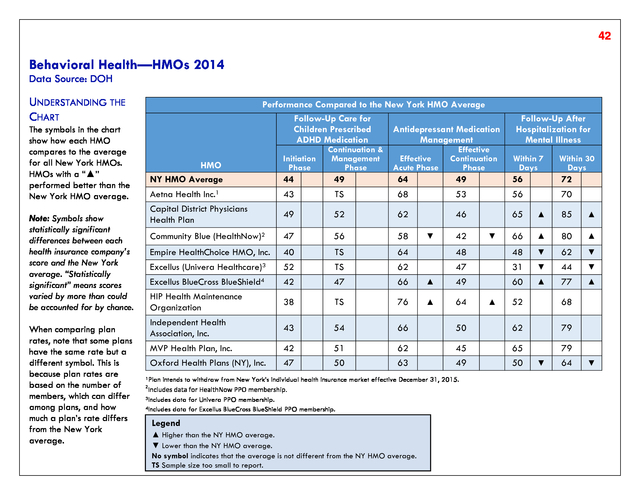
42) 41 Quality of Care and Service for Health Insurance Companies BEHAVIORAL HEALTH MEASURE DESCRIPTIONS ï‚· Follow-Up Care for Children Prescribed ADHD Medication: The percentage of children ages 6–12 years who were newly prescribed ADHD medication and who had at least 3 follow-up visits within a 10-month period, one of which was within 30 days of when the first ADHD medication was dispensed. Two measures assess follow-up care for children taking ADHD medication: – Initiation Phase: The percentage of children with a new prescription for ADHD medication and who had 1 follow-up visit with a practitioner within the 30 days after starting the medication. – Continuation & Management Phase: The percentage of children with a new prescription for ADHD medication, who remained on the medication for 7 months and who, in addition to the visit in the Initiation Phase, had at least 2 follow-up visits in the 9-month period after the Initiation Phase ended. ï‚· Antidepressant Medication Management: Members ages 18 years and older who were diagnosed with depression and treated with an antidepressant medication. The measure has two components of care: – Effective Acute Phase Treatment: The percentage of members who remained on antidepressant medication during the entire 12-week Acute Treatment phase. – Effective Continuation Phase Treatment: The percentage of members who remained on antidepressant medication for at least 6 months. ï‚· Follow-Up After Hospitalization for Mental Illness: Members ages 6 years and older who were hospitalized for treatment of selected mental health disorders (such as depression or bipolar disorder). The measure has two time-frame components: – Within 7 Days: The percentage of members who were hospitalized for treatment of selected mental health disorders and were seen by a mental health provider within 7 days after discharge. – Within 30 Days: The percentage of members who were seen on an ambulatory basis or who were in intermediate treatment with a mental health provider within 30 days of discharge.
43) 42 Behavioral Health—HMOs 2014 Data Source: DOH UNDERSTANDING THE CHART Performance Compared to the New York HMO Average Follow-Up Care for Children Prescribed Antidepressant Medication ADHD Medication Management The symbols in the chart show how each HMO compares to the average for all New York HMOs. HMOs with a “â–²” performed better than the New York HMO average. HMO NY HMO Average Continuation & Management Phase Effective Acute Phase Effective Continuation Phase Within 7 Days Within 30 Days 44 49 64 49 56 72 Aetna Health Inc.1 43 TS 68 53 56 70 Capital District Physicians Health Plan 49 52 62 46 65 â–² 85 â–² Community Blue (HealthNow)2 47 56 58 66 â–² 80 â–² Empire HealthChoice HMO, Inc. 40 TS 64 48 48 â–¼ 62 â–¼ Excellus (Univera Healthcare)3 52 TS 62 47 31 â–¼ 44 â–¼ Excellus BlueCross BlueShield4 42 47 66 â–² 49 60 â–² 77 â–² HIP Health Maintenance Organization 38 TS 76 â–² 64 Independent Health Association, Inc. 43 54 66 MVP Health Plan, Inc. 42 51 Oxford Health Plans (NY), Inc. Note: Symbols show statistically significant differences between each health insurance company’s score and the New York average. “Statistically significant” means scores varied by more than could be accounted for by chance. When comparing plan rates, note that some plans have the same rate but a different symbol. This is because plan rates are based on the number of members, which can differ among plans, and how much a plan’s rate differs from the New York average. Initiation Phase Follow-Up After Hospitalization for Mental Illness 47 50 â–¼ 42 â–¼ 52 68 50 62 79 62 45 65 79 63 49 50 1Plan intends to withdraw from New York’s individual health insurance market effective December 31, 2015. Includes data for HealthNow PPO membership. 3Includes data for Univera PPO membership. 4Includes data for Excellus BlueCross BlueShield PPO membership. 2 Legend â–² Higher than the NY HMO average. â–¼ Lower than the NY HMO average. No symbol indicates that the average is not different from the NY HMO average. TS Sample size too small to report. â–² â–¼ 64 â–¼
44) 43 Behavioral Health—PPOs 2014 Data Source: DOH UNDERSTANDING THE CHART The symbols in the chart show how each PPO compares to the average for all New York PPOs. PPOs with a “â–²” performed better than the New York PPO average. Note: Symbols show statistically significant differences between each health insurance company’s score and the New York average. “Statistically significant” means scores varied by more than could be accounted for by chance. When comparing plan rates, note that some plans have the same rate but a different symbol. This is because plan rates are based on the number of members, which can differ among plans, and how much a plan’s rate differs from the New York average. Performance Compared to the New York PPO Average Follow-Up Care for Children Prescribed Antidepressant Medication ADHD Medication Management PPO1 NY PPO Average Initiation Phase Continuation & Management Phase Effective Acute Phase Effective Continuation Phase Follow-Up After Hospitalization for Mental Illness Within 30 Days 59 73 74 47 52 67 Aetna Life Insurance Company2 45 44 75 CDPHP Universal Benefits, Inc. 47 53 64 Cigna Health and Life Insurance Company 52 60 55 Empire HealthChoice Assurance, Inc. 44 56 67 Group Health Incorporated 44 52 80 â–² 72 â–² 47 HIP Insurance Company of New York TS TS 81 â–² 70 â–² TS TS MVP Health Insurance Company 44 55 60 â–¼ 46 â–¼ 57 72 Oxford Health Insurance, Inc. 49 53 68 57 70 UnitedHealthcare Insurance Company of New York 46 50 64 60 75 1Data 2Plan 53 Within 7 Days â–¼ 65 â–² 61 49 â–² â–¼ 71 â–² 85 34 â–¼ 53 â–¼ 69 51 55 â–¼ 49 for Excellus BlueCross BlueShield PPO, HealthNow PPO and for Univera PPO are included in the HMO tables. intends to withdraw from New York’s individual health insurance market effective December 31, 2015. Legend â–² Higher than the NY PPO average. â–¼ Lower than the NY PPO average. No symbol indicates that the average is not different from the NY PPO average. TS Sample size too small to report. 57 â–¼ â–² 71 â–¼ 59 â–¼ â–²
45) 44 Quality of Care and Service for Health Insurance Companies Quality of Providers MEASURE DESCRIPTIONS ï‚· Satisfaction With Personal Doctor: The percentage of members who responded 8, 9 or 10 (on a scale of 0–10, where 0 is the worst personal doctor possible and 10 is the best personal doctor possible) when asked, “How would you rate your personal doctor?” ï‚· Satisfaction With Specialist: The percentage of members who responded 8, 9 or 10 (on a scale of 0–10, where 0 is the worst specialist possible and 10 is the best specialist possible) when asked “How would you rate your specialist?” ï‚· Satisfaction With Provider Communication: The percentage of members who responded that their doctors or health care providers “usually” or “always”: – Listen carefully to them. – Explain things in a way they understand. – Show respect for what they have to say. – Spend enough time with them during visits. ï‚· Doctors Who Are Certified by a Medical Board: The percentage of internists, OB/GYNs and pediatricians who are board certified. A higher percentage means the health insurance company has more board-certified doctors in the practice areas listed. To be board certified, doctors must receive additional training and pass an exam in their specialty. While board certification is not a guarantee of quality, it shows that a doctor has knowledge that the specialty board considers necessary.
46) 45 Quality of Providers—HMOs 2014 Data Source: DOH UNDERSTANDING THE CHART The symbols in the chart show how each HMO compares to the average for all New York HMOs. HMOs with a “â–²” performed better than the New York HMO average. Note: Symbols show statistically significant differences between each health insurance company’s score and the New York average. “Statistically significant” means scores varied by more than could be accounted for by chance. When comparing plan rates, note that some plans have the same rate but a different symbol. This is because plan rates are based on the number of members, which can differ among plans, and how much a plan’s rate differs from the New York average. Performance Compared to the New York HMO Average HMO NY HMO Average Satisfaction With Personal Doctor 84 Satisfaction With Specialist 82 Satisfaction With Provider Communication 94 Aetna Health Inc.1 83 84 Capital District Physicians Health Plan 88 Community Blue (HealthNow)2 86 85 96 â–² Empire HealthChoice HMO, Inc. 87 84 96 â–² Excellus (Univera Healthcare)3 79 81 Excellus BlueCross BlueShield4 84 HIP Health Maintenance Organization Doctors Who Are Certified by a Medical Board Internal Medicine OB/GYN Pediatric 78 78 81 94 80 â–² 77 83 95 82 â–² 78 83 79 77 88 77 78 79 93 77 80 78 81 96 83 81 79 87 86 93 79 Independent Health Association, Inc. 86 82 95 70 MVP Health Plan, Inc. 86 87 95 78 Oxford Health Plans (NY), Inc. 83 82 94 79 â–² â–¼ 87 â–² â–² 1Plan intends to withdraw from New York’s individual health insurance market effective December 31, 2015. Includes data for HealthNow PPO membership. 3Includes data for Univera PPO membership. 4Includes data for Excellus BlueCross BlueShield PPO membership. 2 Legend â–² Higher than the NY HMO average. â–¼ Lower than the NY HMO average. No symbol indicates that the average is not different from the NY HMO average. â–² 73 â–¼ â–² â–² 79 76 82 79 â–¼ â–² 86 83 â–² 81 â–²
47) 46 Quality of Providers—PPOs 2014 Data Source: DOH UNDERSTANDING THE CHART The symbols in the chart show how each PPO compares to the average for all New York PPOs. PPOs with a “â–²” performed better than the New York PPO average. Performance Compared to the New York PPO Average PPO1 NY PPO Average Satisfaction With Personal Doctor 85 Satisfaction With Specialist 83 Doctors Who Are Certified by a Medical Board Satisfaction With Provider Internal Communication Medicine OB/GYN Pediatric 78 78 80 95 When comparing plan rates, note that some plans have the same rate but a different symbol. This is because plan rates are based on the number of members, which can differ among plans, and how much a plan’s rate differs from the New York average. 83 78 93 CDPHP Universal Benefits, Inc. 88 85 97 Cigna Health and Life Insurance Company 85 85 Empire HealthChoice Assurance, Inc. 77 Group Health Incorporated 89 HIP Insurance Company of New York 89 MVP Health Insurance Company 87 Oxford Health Insurance, Inc. Note: Symbols show statistically significant differences between each health insurance company’s score and the New York average. “Statistically significant” means scores varied by more than could be accounted for by chance. Aetna Life Insurance Company2 UnitedHealthcare Insurance Company of New York 1Data 2Plan 79 76 â–¼ 83 82 â–² 78 83 95 80 â–² NV 71 â–² 80 â–² 75 â–¼ 92 77 â–¼ 79 88 â–² 94 76 â–¼ 71 â–¼ 79 88 â–² 93 79 73 â–¼ 79 86 96 78 79 84 80 95 79 83 â–² 81 87 83 96 80 84 â–² 84 â–¼ â–¼ â–² â–² for Excellus BlueCross BlueShield PPO, HealthNow PPO and for Univera PPO are included in the HMO tables. intends to withdraw from New York’s individual health insurance market effective December 31, 2015. Legend â–² Higher than the NY PPO average. â–¼ Lower than the NY PPO average. No symbol indicates that the average is not different from the NY PPO average. NV Plan submitted invalid data. 86 â–² â–²
48) 47 Quality of Care and Service for Health Insurance Companies Managing Medications MEASURE DESCRIPTIONS ï‚· Drug Therapy for Rheumatoid Arthritis: The percentage of members with rheumatoid arthritis who were dispensed at least one ambulatory prescription for a disease modifying anti-rheumatic drug. – Digoxin: The percentage of members who received at least a 180-day supply of digoxin, and who had at least one blood test for potassium and a monitoring test for kidney function in the measurement year. ï‚· Annual Monitoring for Patients on Persistent Medications: The percentage of members, ages 18 years and older, who were taking certain medications for at least six months and who received specific monitoring tests. The following rates specify categories of medications that are of interest: – Diuretics: The percentage of members who received at least a 180-day supply of diuretics, and who had at least one blood test for potassium and a monitoring test for kidney function in the measurement year. – Ace Inhibitors/ARBs: The percentage of members who received at least a 180-day supply of ACE inhibitors and/or ARBs, and who had at least one blood test for potassium and a monitoring test for kidney function in the measurement year.
49) 48 Managing Medications—HMOs 2014 Data Source: DOH UNDERSTANDING THE CHART The symbols in the chart show how each HMO compares to the average for all New York HMOs. HMOs with a “â–²” performed better than the New York HMO average. HMO NY HMO Average Performance Compared to the New York HMO Average Annual Monitoring for Patients on Persistent Drug Therapy for Medications Rheumatoid Arthritis Ace Inhibitors/ARBs Digoxin Diuretics 86 84 85 83 Aetna Health Inc.1 75 82 â–¼ 84 81 â–¼ Capital District Physicians Health Plan 91 87 â–² 88 87 â–² Community Blue (HealthNow)2 86 80 â–¼ 85 79 â–¼ Note: Symbols show statistically significant differences between each health insurance company’s score and the New York average. “Statistically significant” means scores varied by more than could be accounted for by chance. Empire HealthChoice HMO, Inc. 81 82 â–¼ 82 82 Excellus (Univera Healthcare)3 88 85 94 84 BlueShield4 88 82 â–¼ 83 81 â–¼ 88 â–² 90 87 â–² When comparing plan rates, note that some plans have the same rate but a different symbol. This is because plan rates are based on the number of members, which can differ among plans, and how much a plan’s rate differs from the New York average. Excellus BlueCross â–¼ HIP Health Maintenance Organization 81 Independent Health Association, Inc. 88 84 MVP Health Plan, Inc. 90 82 â–¼ 81 82 Oxford Health Plans (NY), Inc. 85 86 â–² 85 85 â–¼ 1Plan 92 intends to withdraw from New York’s individual health insurance market effective December 31, 2015. data for HealthNow PPO membership. 3Includes data for Univera PPO membership. 4Includes data for Excellus BlueCross BlueShield PPO membership. 2Includes Legend â–² Higher than the NY HMO average. â–¼ Lower than the NY HMO average. No symbol indicates that the average is not different from the NY HMO average. â–² 84 â–²
50) 49 Managing Medications—PPOs 2014 Data Source: DOH UNDERSTANDING THE CHART The symbols in the chart show how each PPO compares to the average for all New York PPOs. PPOs with a “â–²” performed better than the New York PPO average. Note: Symbols show statistically significant differences between each health insurance company’s score and the New York average. “Statistically significant” means scores varied by more than could be accounted for by chance. When comparing plan rates, note that some plans have the same rate but a different symbol. This is because plan rates are based on the number of members, which can differ among plans, and how much a plan’s rate differs from the New York average. PPO1 NY PPO Average Performance Compared to the New York PPO Average Drug Therapy for Annual Monitoring for Patients on Persistent Rheumatoid Medications Arthritis Ace Inhibitors/ARBs Digoxin Diuretics 81 85 86 84 Aetna Life Insurance Company2 85 â–² 84 85 83 CDPHP Universal Benefits, Inc. 90 â–² 84 85 84 Cigna Health and Life Insurance Company 84 85 84 85 Empire HealthChoice Assurance, Inc. 68 â–¼ 86 â–² 91 86 â–² Group Health Incorporated 75 â–¼ 87 â–² 91 85 â–² HIP Insurance Company of New York 81 85 TS 85 MVP Health Insurance Company 84 84 92 83 Oxford Health Insurance, Inc. 80 85 84 84 UnitedHealthcare Insurance Company of New York 82 82 81 81 1Data 2Plan â–¼ for Excellus BlueCross BlueShield PPO, HealthNow PPO and for Univera PPO are included in the HMO tables. intends to withdraw from New York’s individual health insurance market effective December 31, 2015. Legend â–² Higher than the NY PPO average. â–¼ Lower than the NY PPO average. No symbol indicates that the average is not different from the NY PPO average. TS Sample size too small to report. â–¼
51) 50 Health Insurance Company Accreditation Accreditation is a way of assessing health insurance company quality. It assures consumers that an independent organization has checked whether the health insurance company has effective systems in place for offering high-quality care. Health insurance companies may request an accreditation review; however, since accreditation is voluntary, not all companies request the review. What Is NCQA Accreditation? The National Committee for Quality Assurance (NCQA) is a private, nonprofit organization dedicated to improving health care by assessing and reporting on the quality of health insurance companies. NCQA’s team of doctors and health care experts conduct a comprehensive review of a health insurance company’s structure (against more than 60 different standards) and processes to maintain and improve quality in five core areas. Health insurance companies must also submit results of clinical performance measures (known as “HEDIS”) and patient experience of care (known as “CAHPS”) as part of the accreditation process. HEDIS is an evaluation of the plan’s performance on process and outcomes and makes it possible to compare company performance fairly. CAHPS is a standardized survey used by all health insurance companies. For more information on NCQA, visit www.ncqa.org. NCQA Accreditation Outcomes Are Based on Health Insurance Company Performance Excellent indicates that the health insurance company demonstrates levels of service and clinical quality that meet or exceed NCQA’s requirements for consumer protection and quality improvement. HEDIS results are in the highest range of national performance. ï‚· Commendable indicates that the health insurance company demonstrates levels of service and clinical quality that meet NCQA’s requirements for consumer protection and quality improvement. ï‚· Accredited indicates that the health insurance company meets most of NCQA’s basic requirements. ï‚· Provisional indicates that the health insurance company meets some of NCQA’s basic requirements. ï‚· Denied indicates that the health insurance company does not meet NCQA’s basic requirements. ï‚· Not Reviewed indicates that the health insurance company has not requested NCQA review. ï‚· Interim indicates that the health insurance company has basic structure and processes in place to meet expectations for consumer protection and quality improvement. Organizations awarded this status will need to undergo a new review within 18 months to demonstrate they have executed those processes effectively. ï‚·
52) 51 NCQA Accreditation Status as of July 20151 NCQA Accreditation Status as of July 20151 HMO Accreditation Status Aetna Health Inc. Commendable Capital District Physicians Health Plan Excellent Community Blue (HealthNow) Excellent Empire HealthChoice HMO, Inc. Commendable Excellus Health Plan Commendable HIP Health Maintenance Organization Commendable Independent Health Association, Inc. Excellent MVP Health Plan, Inc. Excellent Oxford Health Plans (NY), Inc. Accredited United Healthcare of New York, Inc. Commendable EPO/PPO Health Plan Accreditation Status CDPHP Universal Benefits, Inc. Excellent Empire HealthChoice Assurance, Inc. Not Reviewed Excellus Health Plan, Inc. Commendable Group Health Incorporated Not Reviewed Health Republic Insurance of New York, Corp. Not Reviewed HealthNow New York Inc. Excellent HIP Insurance Company of New York Not Reviewed Independent Health Benefits Corporation Commendable MVP Health Insurance Company Not Reviewed Oscar Insurance Corporation Interim Oxford Health Insurance, Inc. Commendable UnitedHealthcare Insurance Company of New Accredited York Commercial Health Insurance Company Aetna Life Insurance Company American Family Life Assurance Company of New York American Progressive Life and Health Insurance BCS Insurance Company Berkshire Life Insurance Company of America CIGNA Health and Life Insurance Company CIGNA Life Insurance Company of New York Combined Life Insurance Company of New York Delta Dental Insurance Company Dentcare Delivery Systems, Inc. Eastern Vision Service Plan, Inc. First Unum Life Insurance Company Genworth Life Insurance Company of New York Guardian Life Insurance Company of America Hartford Life Insurance Company HM Life Insurance Company of New York John Hancock Life & Health Insurance Company Liberty Life Assurance Company of Boston Lincoln Life & Annuity Company of New York Massachusetts Mutual Life Insurance Company Metropolitan Life Insurance Company MVP Health Services Corporation National Union Fire Insurance Company of Pittsburgh, PA 1Accreditation Accreditation Status Commendable Not Reviewed Not Reviewed Not Reviewed Not Reviewed Commendable Not Reviewed Not Reviewed Not Reviewed Not Reviewed Not Reviewed Not Reviewed Not Reviewed Not Reviewed Not Reviewed Not Reviewed Not Reviewed Not Reviewed Not Reviewed Not Reviewed Not Reviewed Excellent Not Reviewed status does not include Medicare or Medicaid products.
53) 52 NCQA Accreditation Status as of July 20151 Commercial Health Insurance Company New York Life Insurance Company Nippon Life Insurance Company of America Northwestern Mutual Life Insurance Company Oxford Health Insurance, Inc. Paul Revere Life Insurance Company Principal Life Insurance Company Prudential Insurance Company of America ShelterPoint Life Insurance Company Standard Life Insurance Company of New York Standard Security Life Insurance Company of New York Sun Life and Health Insurance Company Transamerica Financial Life Insurance Company of the City of New York United State Fire Insurance Company 1Accreditation Accreditation Status Not Reviewed Not Reviewed Not Reviewed Commendable Not Reviewed Not Reviewed Not Reviewed Not Reviewed Not Reviewed Not Reviewed Not Reviewed Not Reviewed Not Reviewed status does not include Medicare or Medicaid products.
54) 53 How Health Insurance Companies Pay Health Care Providers New York State health insurance companies pay health care providers (“providers”) in a variety of contractual methods; some of them are described below. A typical health insurance company may use more than one method. No one method is “best” or “right.” Ask your doctor if you have questions or concerns about how your health insurance company pays providers. PAYMENT METHODS ï‚· Fee for Service: The health insurance company pays providers for each office visit, procedure and test. Payment is usually based on an allowable fee or “usual and customary reimbursement.” ï‚· Capitation: The health insurance company pays providers the same amount every month for every member under their primary care, regardless of the services a member receives. Supporters of capitation believe it gives physicians an incentive to keep people healthy through preventive care in order to avoid costly illnesses; others believe it creates an incentive to avoid providing necessary, but expensive, services. ï‚· Bonus: The health insurance company pays providers additional amounts if they meet quality, customer-service or cost-saving goals. ï‚· Withhold: The health insurance company withholds a portion of the provider’s payment to cover unexpected services such as specialty care, laboratory services or hospitalization. If patients do not use these services, the health insurance company returns the withheld amount to the physician. Some believe that this method helps reduce unnecessary expenses; others believe it discourages providers from offering necessary services. ï‚· Balance Billing: A billing practice in which consumers are billed for the difference between what their insurance company pays and the fee that the provider normally charges. Balance billing is prohibited under most HMO contracts in New York, but may occur if members use the services of out-of-network providers under a PPO or POS arrangement.
55) 54 Overall Complaint Ranking Each year, DFS receives complaints about health insurance companies from consumers and health care providers. After reviewing each complaint, DFS determines if the health insurance company acted appropriately. If DFS determines that the health insurance company did not act in accordance with its statutory and contractual obligations, the health insurance company must resolve the problem to come into compliance. The overall rank of all New York State insurance companies (HMOs, EPO/PPO health plans and commercial health insurance companies) is based on complaints closed by DFS. It is not possible to compare different types of health insurance companies on a standardized basis. Consumers should consider a health insurance company’s ranking in its category, as well as its overall ranking. UNDERSTANDING THE CHARTS ï‚· Rank: Each health insurance company’s ranking is based on how many complaints were resolved by DFS in favor of the member or provider, relative to the company’s premiums. A lower number results in a higher ranking. If the ratios are the same, the health insurance company with the higher premiums is ranked higher. ï‚· Premiums: Dollar amount generated by a health insurance company in New York State during 2014. Premiums are used to calculate the complaint ratio so that health insurance companies of different sizes can be compared fairly. Premium data exclude Medicare and Medicaid. ï‚· Total Complaints: Total number of complaints closed by DFS in 2014. Large health insurance companies may receive more complaints because they have more consumers than smaller health insurance companies. ï‚· Complaint Ratio: Number of complaints upheld (complaints resolved by DFS in favor of the member or provider) divided by the health insurance company’s premiums. ï‚· Complaints Upheld: Number of closed complaints resolved in favor of the member or provider because DFS determined that the health insurance company did not comply with statutory or contractual obligations. Complaints upheld by DFS are used to calculate the complaint ratio and ranking.
56) 55 Overall Complaint Ranking—2014 Data Source: DFS Health Insurance Company/HMO Independent Health Benefits Corporation (E) Independent Health Association, Inc. (H) Prudential Insurance Company of America (C) Hartford Life Insurance Company (C) MVP Health Services Corporation (C),3 National Union Fire Insurance Company of Pittsburgh, PA (C) Sun Life and Health Insurance Company (C) CIGNA Life Insurance Company of New York (C) Northwestern Mutual Life Insurance Company (C) Eastern Vision Service Plan, Inc. (C),4 ShelterPoint Life Insurance Company (C) HM Life Insurance Company of New York (C) Berkshire Life Insurance Company of America (C) Standard Security Life Insurance Company of New York (C) Oscar Insurance Corporation (E) Dentcare Delivery Systems, Inc. (C),3 Paul Revere Life Insurance Company (C) Lincoln Life & Annuity Company of New York (C) United States Fire Insurance Company (C) Liberty Life Assurance Company of Boston (C) First Unum Life Insurance Company (C) Community Blue (Healthnow) (H) 1If Rank1,2 1 2 3 4 5 6 7 8 9 10 11 12 13 14 15 16 17 18 19 20 21 22 Total Complaints Complaints Upheld 1 0 18 0 9 0 4 0 0 0 4 0 1 0 6 0 4 0 0 0 2 0 0 0 1 0 2 0 15 0 9 0 2 0 8 0 4 0 1 0 24 1 12 1 Premiums (Millions $) 476.76 286.66 123.18 105.06 101.52 99.99 92.93 87.63 87.06 86.92 83.79 74.30 68.03 66.96 60.93 54.84 54.68 52.66 52.09 50.20 265.89 156.56 the ratios are the same among health insurance companies, the health insurance company with the higher premium amount receives a higher ranking. insurance companies with a lower complaint ratio receive a higher ranking. 3Plan issues dental coverage only. 4Plan issues vision coverage only. 2Health Complaint Ratio 0.0000 0.0000 0.0000 0.0000 0.0000 0.0000 0.0000 0.0000 0.0000 0.0000 0.0000 0.0000 0.0000 0.0000 0.0000 0.0000 0.0000 0.0000 0.0000 0.0000 0.0038 0.0064 Legend Commercial Health Insurance Company E EPO/PPO Health Plan H HMO C
57) 56 Overall Complaint Ranking—2014 Data Source: DFS Health Insurance Company/HMO Rank1,2 American Family Life Assurance Company of New York (C) CDPHP Universal Benefits, Inc. (E),3 HealthNow New York Inc. (E),3 Guardian Life Insurance Company of America (C) Capital District Physicians Health Plan (H) Metropolitan Life Insurance Company (C) Massachusetts Mutual Life Insurance Company (C) Delta Dental of New York, Inc. (C),4 American Progressive Life and Health Insurance (C) New York Life Insurance Company (C) 23 24 25 26 27 28 29 30 31 32 33 34 35 36 37 38 39 40 41 42 43 44 Genworth Life Insurance Company of New York (C) Principal Life Insurance Company (C) BCS Insurance Company (C) Standard Life Insurance Company of New York (C) Excellus Health Plan, Inc. (E),3 MVP Health Plan, Inc. (H) MVP Health Insurance Company (E),3 Nippon Life Insurance Company of America (C) Oxford Health Insurance, Inc. (E),3 UnitedHealthcare Insurance Company of New York (E),3 CIGNA Health and Life Insurance Company (C),3 Aetna Life Insurance Company (C),3,5 1If Total Complaints Complaints Upheld 11 2 18 5 49 10 23 3 40 5 42 7 4 1 7 2 9 4 7 1 11 3 3 1 1 1 1 1 258 70 89 15 32 8 7 2 608 158 196 60 76 37 250 88 Premiums (Millions $) 275.95 688.25 1,355.00 372.36 592.94 581.52 77.91 154.97 302.86 71.91 184.85 60.73 54.64 54.18 3,764.46 675.10 353.28 79.45 5,691.62 1,971.91 1,132.06 2,425.38 the ratios are the same among health insurance companies, the health insurance company with the higher premium amount receives a higher ranking. insurance companies with a lower complaint ratio receive a higher ranking. 3Complaints, complaint ratios, and premiums include data from the health insurance company’s EPO, PPO and commercial business. 4Plan issues dental coverage only. 5Plan intends to withdraw from New York’s individual health insurance market effective December 31, 2015.z 2Health Complaint Ratio 0.0072 0.0073 0.0074 0.0081 0.0084 0.0120 0.0128 0.0129 0.0132 0.0139 0.0162 0.0165 0.0183 0.0185 0.0186 0.0222 0.0226 0.0252 0.0278 0.0304 0.0327 0.0363 Legend Commercial Health Insurance Company E EPO/PPO Health Plan H HMO C
58) 57 Overall Complaint Ranking—2014 Data Source: DFS Health Insurance Company/HMO Excellus Health Plan (H) Combined Life Insurance Company of New York (C) John Hancock Life & Health Insurance Company (C) HIP Health Maintenance Organization (H) Transamerica Financial Life Insurance Company (C) Oxford Health Plans (NY), Inc. (H) Empire HealthChoice Assurance, Inc. (E),3 Aetna Health Inc. (H),4 Group Health Incorporated (E),3 UnitedHealthcare of New York, Inc. (H) HIP Insurance Company of New York (E),3 Empire HealthChoice HMO, Inc. (H) 1If Total Complaints Premiums Complaints Upheld (Millions $) 45 31 8 209.64 46 26 5 109.03 47 23 6 125.16 48 281 124 2,182.82 49 23 7 109.25 50 342 94 1,291.53 51 712 152 2,048.57 52 64 27 310.40 53 363 148 1,504.52 54 59 16 105.55 55 29 18 60.72 56 657 256 675.92 Total 4,827 1,561 32,789.04 Rank1,2 the ratios are the same among health insurance companies, the health insurance company with the higher premium amount receives a higher ranking. insurance companies with a lower complaint ratio receive a higher ranking. 3Complaints, complaint ratios, and premiums include data from the health insurance company’s EPO, PPO and commercial business. 4Plan intends to withdraw from New York’s individual health insurance market effective December 31, 2015. 2Health Complaint Ratio 0.0382 0.0459 0.0479 0.0568 0.0641 0.0728 0.0742 0.0870 0.0984 0.1516 0.2964 0.3787 0.0476 Legend Commercial Health Insurance Company E EPO/PPO Health Plan H HMO C
59) 58 Telephone Numbers for Health Insurance Companies HMO Aetna Health Inc. 800-435-8742 EPO/PPO Health Plan CDPHP Universal Benefits, Inc. Capital District Physicians Health Plan 800-777-2273 Empire HealthChoice Assurance, Inc. 800-261-5962 Community Blue (HealthNow) 800-544-2583 Excellus Health Plan, Inc. 800-847-1200 Empire HealthChoice HMO, Inc. 800-261-5962 Group Health Incorporated (GHI) 800-444-2333 Excellus Health Plan 800-633-6066 Health Republic Insurance of New York, Corp. 888-990-5702 HIP HMO 800-447-8255 HealthNow New York, Inc. 800-888-0757 Independent Health Association, Inc. 800-453-1910 HIP Insurance Company of New York 800-447-8255 MVP Health Plan, Inc. 800-825-5687 Independent Health Benefits Corporation 800-453-1910 Oxford Health Plans (NY), Inc. 800-969-7480 MVP Health Insurance Company 800-825-5687 UnitedHealthcare of New York, Inc. 877-832-7734 Oscar Insurance Corporation 855-672-2788 Oxford Health Insurance, Inc. 800-969-7480 UnitedHealthcare Insurance Company of New York 877-832-7734 877-269-2134
60) 59 Telephone Numbers for Health Insurance Companies Commercial Health Insurance Company1 Aetna Life Insurance Company 800-872-3862 Commercial Health Insurance Company1 Lincoln Life & Annuity Company of New York 800-423-2765 American Family Life Assurance Company of New York 800-366-3436 Massachusetts Mutual Life Insurance Company 800-272-2216 Metropolitan Life Insurance Company 800-334-4298 American Progressive Life and Health Insurance 800-332-3377 ext. 5559839 MVP Health Services Corporation 800-825-5687 BCS Insurance Company 800-621-9215 National Union Fire Insurance Company of Pittsburgh, PA 877-638-4244 Berkshire Life Insurance Company of America 800-819-2468 New York Life Insurance Company 800-695-9873 Cigna Health & Life Insurance Company 800-244-6224 Nippon Life Insurance Company of America 800-374-1835 CIGNA Life Insurance Company of New York 800-244-6224 Northwestern Mutual Life Insurance Company 800-388-8123 Combined Life Insurance Company of New York 800-490-1322 Paul Revere Life Insurance Company 800-265-3199 Delta Dental of New York 800-932-0783 Principal Life Insurance Company of America 800-986-3343 Dentcare Delivery Systems, Inc. 800-468-0608 Prudential Insurance Company of America 877-301-1212 Eastern Vision Service Plan, Inc. 800-877-7195 ShelterPoint Life Insurance Company 800-365-4999 First Unum Life Insurance Company 866-679-3054 Standard Life Insurance Company of New York 888-937-4783 Genworth Life Insurance Company of New York 888-436-9678 Standard Security Life Insurance Company of New York 800-477-0087 Guardian Life Insurance Company of America 888-482-7342 Sun Life and Health Insurance Company 800-786-5433 Hartford Life Insurance Company 800-523-2233 HM Life Insurance Company of New York 800-328-5433 Transamerica Financial Life Insurance Company 888-763-7474 John Hancock Life & Health Insurance Company 800-732-5543 United States Fire Insurance Company 800-232-7380 Liberty Life Assurance Company of Boston 800-373-0378 1Commercial health insurance companies generally do not offer health insurance coverage to individuals.
61) 60 Contacts and Resources QUESTIONS ABOUT THIS GUIDE? Contact: New York State Department of Financial Services One Commerce Plaza Albany, NY 12257 800-342-3736 (Monday-Friday, 8:30AM4:30PM) For printed copies of the PDF, visit: www.dfs.ny.gov/consumer/chealth.htm, or call DFS at the phone number listed above. PROBLEM WITH YOUR HEALTH INSURANCE COMPANY? First, contact your health insurance company’s Member Services Department to try to resolve the issue. If the problem is not resolved to your satisfaction, call the appropriate state agency for assistance. For issues concerning payment, reimbursement, coverage, benefits and premiums, contact: Consumer Assistance Unit New York State Department of Financial Services One Commerce Plaza Albany, NY 12257 800-342-3736 www.dfs.ny.gov/consumer/fileacomplaint.htm If you were denied coverage of health care services because your health insurance company considers them experimental, investigational, not medically necessary, a clinical trial, a rare disease treatment, an out-ofnetwork service or, an out-of-network referral, contact: New York State Department of Financial Services New York State External Appeal PO Box 7209 Albany, NY 12224 800-400-8882 E-mail: externalappealquestions@dfs.ny.gov For general information: www.dfs.ny.gov/insurance/extapp/extappqa.htm For an external appeal application: www.dfs.ny.gov/insurance/extapp/extappl.pdf For issues concerning HMO quality of care, contact: New York State Department of Health Bureau of Managed Care Certification and Surveillance Complaint Unit Room, 2019 Corning Tower ESP Albany, NY 12237 800-206-8125 www.health.ny.gov/health_care/managed_c are/complaints/index.htm Under federal law, if you receive health coverage through a self-insured plan covered by ERISA, New York consumer protections and insurance laws do not apply. If you have a complaint regarding a self-insured plan, contact: United States Department of Labor Employee Benefits Security Administration 200 Constitution Avenue, NW Washington, DC 20210 202-693-8700 866-444-EBSA www.dol.gov/ebsa/aboutebsa/main.html For issues concerning insurance fraud, contact: New York State Department of Financial Services Insurance Frauds Bureau 1 State Street New York, NY 10004 800-342-3736 www.dfs.ny.gov/consumer/scamsfraud.htm
62) 61 Contacts and Resources INFORMATION ABOUT NY STATE OF HEALTH Under the Affordable Care Act, New York State operates a health benefits exchange called the New York State of Health (NYSOH). An exchange is an organized marketplace designed to help people shop for and enroll in health insurance coverage. The NYSOH is an open and transparent marketplace where individuals and small businesses can compare rates, benefits and select the most appropriate health insurance plans. Federal tax credits may be available to help qualified consumers and small businesses pay for the coverage. Essential Health Benefits The Affordable Care Act ensures that health plans offered in the NYSOH for individuals and small businesses include a comprehensive package of items and services, known as essential health benefits. Health plans offered outside of the NYSOH to individuals and small businesses must also include coverage of essential health benefits. Essential health benefits must include items and services within at least the following categories: ï‚· Ambulatory patient services. ï‚· Emergency services. ï‚· Hospitalization. ï‚· Maternity and newborn care. ï‚· Mental health and substance use disorder services, including behavioral health treatment (this includes counseling and psychotherapy). ï‚· Prescription drugs. ï‚· Rehabilitative and habilitative services and devices (services and devices to help people with injuries, disabilities, or chronic conditions gain or recover mental and physical skills). ï‚· Laboratory services. ï‚· Preventive and wellness services and chronic disease management. ï‚· Pediatric services, including oral and vision care. Health plans offered inside and outside the NYSOH to individuals and small businesses must provide certain levels of benefits. The Affordable Care act defines the levels in four metal tiers: ï‚· Bronze. ï‚· Silver. ï‚· Gold. ï‚· Platinum. The lower metal tiers (Bronze and Silver) will have lower premiums but consumers will be required to cover more of the cost of each service they receive. This may be achieved through higher deductibles, co-payments and/or co-insurance. The higher metal tiers (Gold and Platinum) have higher premiums but a lower cost share amount for each service. This concept allows greater flexibility for consumers when choosing a health plan. Consumers should assess their health care needs and choose the plan that best suits their requirements. Further detail about the metal tiers and plans available through NYSOH may be obtained by visiting: www.nystateofhealth.ny.gov/ Small Businesses What is considered a small business with regard to NY State of Health? In general, if you have 50 or fewer full-time equivalent (FTE) employees, you are considered a small business and may get employee insurance through the Small Business Marketplace. What is the Small Business Marketplace? The Small Business Marketplace is a program that simplifies the process of buying health insurance for your small business. The Small Business Marketplace gives you choice and control over health costs. ï‚· You control the coverage you offer to your employees and how much you pay toward employee premiums. ï‚· You can research comparable health plans online, which will help you make a decision that's right for your business. ï‚· You may qualify for a small business health care tax credit worth up to 50% of your premium costs. You can still deduct from your taxes the rest of your premium costs not covered by the tax credit.
63) 62 Contacts and Resources APPLYING FOR HEALTH INSURANCE OFFERED ON NY STATE OF HEALTH Open enrollment will begin on November 1, 2015, for coverage effective January 1, 2016. A Special Enrollment Period may also be available to those individuals who have had a qualifying life event. For further information on how to apply for coverage through NYSOH or to see if you qualify for a Special Enrollment Period, contact 855-355-5777 or visit: www.nystateofhealth.ny.gov/ QUESTIONS ABOUT THE AFFORDABLE CARE ACT AND THE NY STATE OF HEALTH? For further information about NYSOH, contact 855-355-5777, or visit: www.nystateofhealth.ny.gov/ For further information about the Affordable Care Act, visit: www.healthcare.gov QUESTIONS ABOUT MEDICARE, MEDICAID AND CHILD HEALTH PLUS? For information about Medicare, Medicare Advantage or Medicare Part D coverage, contact: Centers for Medicare & Medicaid Services 800-MEDICARE (800-633-4227) or visit: www.medicare.gov New York State Office for the Aging Health Insurance Information Counseling & Assistance Program (HIICAP) 800-701-0501 or visit: www.aging.ny.gov/healthbenefits/ For information about New York’s Medicaid program, contact your local county Department of Social Services. For a listing of local Departments of Social Services visit: www.health.ny.gov/health_care/medicaid/ldss .htm Child Health Plus Health insurance program for children under 19 years of age. For further information about Child Health Plus, contact 800-698-4KIDS (800-698-4543) or visit: www.health.ny.gov/health_care/child_health_p lus/index.htm To apply for Child Health Plus, contact the NYSOH at 855-355-5777 or visit: https://nystateofhealth.ny.gov/ QUESTIONS ABOUT HEALTHY NY? The Healthy NY program offers reduced cost health insurance to eligible small businesses and their employees. For further information about the Healthy NY program, contact 866-HEALTHYNY (866-4325849) or visit: www.dfs.ny.gov/healthyny/ Related Resources NYS DOH Managed Care Plan Performance Reports For health plan performance on primary and preventive health care, access to health care, behavioral health and enrollee satisfaction, visit: www.health.ny.gov/health_care/managed_care /reports/