Severity: Notice
Message: Undefined variable: content_category
Filename: user/transcript.php
Line Number: 106
Severity: Warning
Message: Invalid argument supplied for foreach()
Filename: user/transcript.php
Line Number: 106


1) leadership series MARCH 2016 High-Yield Bond Funds in a Diversified Portfolio AUTHOR KEY TAKEAWAYS • The addition of high-yield bonds as a long-term investment in a diversified portfolio can potentially enhance a portfolio’s risk-and-return prospects. • The power of high yield can be attributed to its hybrid traits of offering a yield premium and the potential for capital appreciation. • In our view, credit selection—the overwhelming source of risk in a high-yield bond portfolio—is best managed with an active strategy based on intensive research focused on identifying and valuing credit risk. • There is a diverse spectrum of high-yield bond fund management styles for investors to consider relative to their goals and risk tolerances. Matt Conti Portfolio Manager Michael Cheng Quantitative Analyst Scott Mensi Director, Investment Product
2) leadership series MARCH 2 016 Understanding high yield The potential benefit of adding HY bonds to a portfolio of stocks and IG bonds can be attributed to the asset’s hybrid traits—a combination of bond-like and stock-like performance characteristics, which are apparent when comparing the correlation of HY against stocks and also against IG bonds (Exhibit 1). For example, HY bonds have had a negative correlation with 10-year Treasury bonds, and a marginally positive correlation with IG bonds as represented by the Barclays U.S. Aggregate Bond Index. In terms of correlation with stocks, the figures were higher, at 0.62. Of course, for those HY bond funds that invest in stocks, the potential correlations with stocks would be higher. When investors wisely use their goals and time horizon to guide their investment selections, it typically results in a portfolio of investments with each holding offering distinctive risk-and-return characteristics. For example, in a diversified portfolio, a stock allocation may make sense given its potential for growth, and in some instances growth and income. Investment-grade (IG) bonds are often included for their historically low volatility relative to equities, diversification properties, and income potential. In many diversified portfolios, broadening the bond allocation to include high-yield (HY) bonds can potentially deliver another facet of income and capital appreciation that can diversify equity and IG bond exposure while at the same time enhance a portfolio’s opportunity for income. Exhibit 1 Imperfect correlations with stocks and IG bonds can make HY bonds an effective diversifier CORRELATION MATRIX: JAN. 1994 TO DEC. 2015 U.S. Equity High Yield Bank Loan EmergingMkt. Debt Investment Grade 10-Year Treasury U.S. Equity 1.00 High Yield 0.62 1.00 Bank Loan 0.42 0.76 1.00 Emerging-Market Debt (EMD) 0.53 0.53 0.26 1.00 Investment Grade 0.04 0.25 (0.02) 0.35 1.00 10-Year Treasury (0.18) (0.08) (0.32) 0.17 0.91 1.00 0.03 (0.06) (0.02) 0.03 0.12 0.06 T-Bill T-Bill 1.00 The Correlation Matrix reveals the strength of return relationships between investments. A perfect linear relationship is represented by a correlation of 1, while a perfect negative relationship has a correlation of –1. A correlation of 0 indicates no relationship between the investments. Correlation is a critical component to asset allocation and can be a useful way to measure the diversity of a portfolio. Diversification and asset allocation do not ensure a profit or guarantee against loss. Past performance is no guarantee of future results. Source: Fidelity Investments. Monthly returns from Jan. 1994 to Dec. 2015. (EMD index started Jan. 1994.) U.S. equity: S&P 500 Index; High Yield: BofA ML U.S. Cash Pay High Yield Index; Bank Loan: Credit Suisse Leveraged Loan Index; Emerging-Market Debt: JP Morgan EMBI Global Index; Investment Grade: Barclays U.S. Aggregate Bond Index; 10-Year Treasury: BofA ML Current 10-Year U.S. Treasury Index; T-Bill: Citigroup 3-Month Treasury Bill Index. See endnotes for index definitions. 2
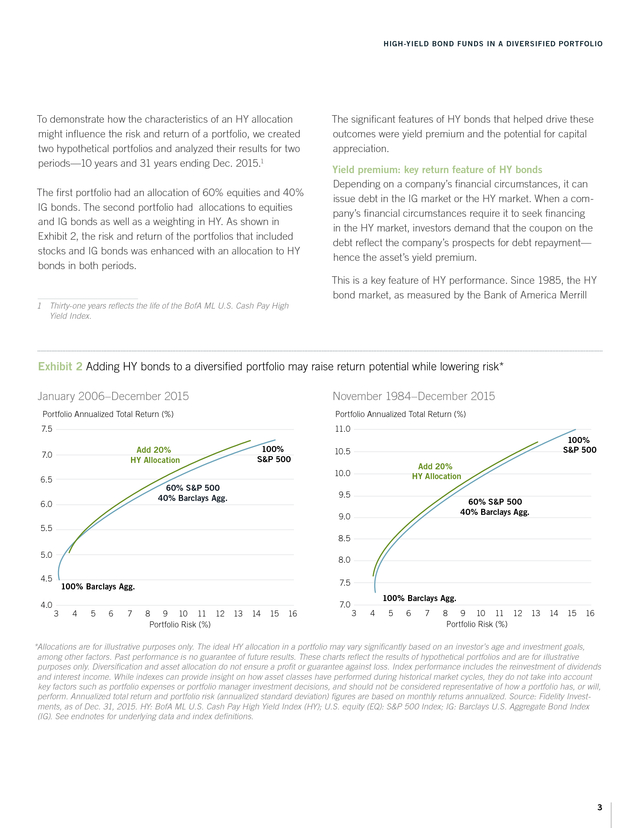
3) HIGH-YIELD BOND FUNDS IN A DIVERSIFIED PORTFOLIO To demonstrate how the characteristics of an HY allocation might influence the risk and return of a portfolio, we created two hypothetical portfolios and analyzed their results for two periods—10 years and 31 years ending Dec. 2015.1 The first portfolio had an allocation of 60% equities and 40% IG bonds. The second portfolio had allocations to equities and IG bonds as well as a weighting in HY. As shown in Exhibit 2, the risk and return of the portfolios that included stocks and IG bonds was enhanced with an allocation to HY bonds in both periods. The significant features of HY bonds that helped drive these outcomes were yield premium and the potential for capital appreciation. Yield premium: key return feature of HY bonds Depending on a company’s financial circumstances, it can issue debt in the IG market or the HY market. When a company’s financial circumstances require it to seek financing in the HY market, investors demand that the coupon on the debt reflect the company’s prospects for debt repayment— hence the asset’s yield premium. This is a key feature of HY performance. Since 1985, the HY bond market, as measured by the Bank of America Merrill 1  Thirty-one years reflects the life of the BofA ML U.S. Cash Pay High Yield Index. Exhibit 2 Adding HY bonds to a diversified portfolio may raise return potential while lowering risk* January 2006–December 2015 November 1984–December 2015 Portfolio Annualized Total Return (%) Portfolio Annualized Total Return (%) 7.5 11.0 100% S&P 500 Add 20% HY Allocation 7.0 100% S&P 500 10.5 Add 20% HY Allocation 10.0 6.5 60% S&P 500 40% Barclays Agg. 6.0 9.5 60% S&P 500 40% Barclays Agg. 9.0 5.5 8.5 5.0 8.0 4.5 4.0 7.5 100% Barclays Agg. 3 4 5 6 7 8 9 10 11 12 Portfolio Risk (%) 13 14 15 16 7.0 100% Barclays Agg. 3 4 5 6 7 8 9 10 11 12 Portfolio Risk (%) 13 14 15 16 *Allocations are for illustrative purposes only. The ideal HY allocation in a portfolio may vary significantly based on an investor’s age and investment goals, among other factors. Past performance is no guarantee of future results. These charts reflect the results of hypothetical portfolios and are for illustrative purposes only. Diversification and asset allocation do not ensure a profit or guarantee against loss. Index performance includes the reinvestment of dividends and interest income. While indexes can provide insight on how asset classes have performed during historical market cycles, they do not take into account key factors such as portfolio expenses or portfolio manager investment decisions, and should not be considered representative of how a portfolio has, or will, perform. Annualized total return and portfolio risk (annualized standard deviation) figures are based on monthly returns annualized. Source: Fidelity Investments, as of Dec. 31, 2015. HY: BofA ML U.S. Cash Pay High Yield Index (HY); U.S. equity (EQ): S&P 500 Index; IG: Barclays U.S. Aggregate Bond Index (IG). See endnotes for underlying data and index definitions. 3
4) leadership series MARCH 2 016 Lynch Cash Pay HY Index, has not posted two consecutive calendar years of negative performance. In fact, there have been only six years of negative returns during the past 31 years. This can be attributed in part to the relatively large average historical coupon payment of 6% to 7% that has typically distinguished HY bonds. The income component has contributed a source of return, or cushion, when bond prices have declined or interest rates have risen (Exhibit 3). potential for an HY bond—albeit typically capped at par if held to maturity and therefore asymmetric—as well as its downside risk, can be more similar to that of a stock than an IG bond. While HY bond yields can be additive to total return performance, it is significant to note that their levels reflect a company’s degree of leverage. Reaching for yield does not necessarily mean a positive outcome—income is not outcome. Without thorough credit analysis and issue selection, price declines can overwhelm income. The bifurcated return potential for HY—coupon income and potential price change—can be seen in different economic environments (Exhibit 4). From 1995 through mid-2015, the asset generated healthy income returns that more than offset minor price declines when GDP was negative and when it ranged from only zero to two percent. Even in slow-growth environments, HY bonds posted strong performance. This is largely due to the compounding of relatively high income payments as well as bond prices bolstered by favorable fundamentals of stable free cash flows available to service debt. Potential for capital appreciation An HY company’s leverage intensifies its bond’s sensitivity to enhanced or deteriorating cash-flow prospects. The upside Active management is key in HY investing Credit risk is the largest source of risk in an HY bond fund— in our estimation, 80% of a fund’s total portfolio risk. Active Exhibit 3 Negative annual returns for HY have not been common Exhibit 4 U.S. HY in various economic environments, Oct. 1986 to Sep. 2015 Annual High Yield Total Return (%) 70 Annualized Return 12% 60 10% Income Return BofA ML U.S. Cash Pay HY Index Total Return 50 40 6% 30 4% 20 8.14% 5.37% Total Return 0% 0 –3% –10 –4% –20 –6% –30 1985 1990 1995 2000 2005 2010 2015 Past performance is no guarantee of future results. This chart is for illustrative purposes only and does not represent actual or future performance of any investment option. Index performance includes the reinvestment of dividends and interest income. Securities indices are not subject to fees and expenses typically associated with investment funds. Source: Bloomberg Finance L.P., as of Dec. 31, 2015. 4 8.45% 2% 10 –40 9.42% 8% Price Return Contraction Slow Growth Expansion All Periods Past performance is no guarantee of future results. Source: National Bureau of Economic Research (NBER), Bank of America/Merrill Lynch. Performance represented by the BofA Merrill Lynch U.S. High Yield Index from Oct. 1986 through Sep. 2015. NBER defines slow growth as GDP from 0% to 2%, expansion as GDP more than 2%.
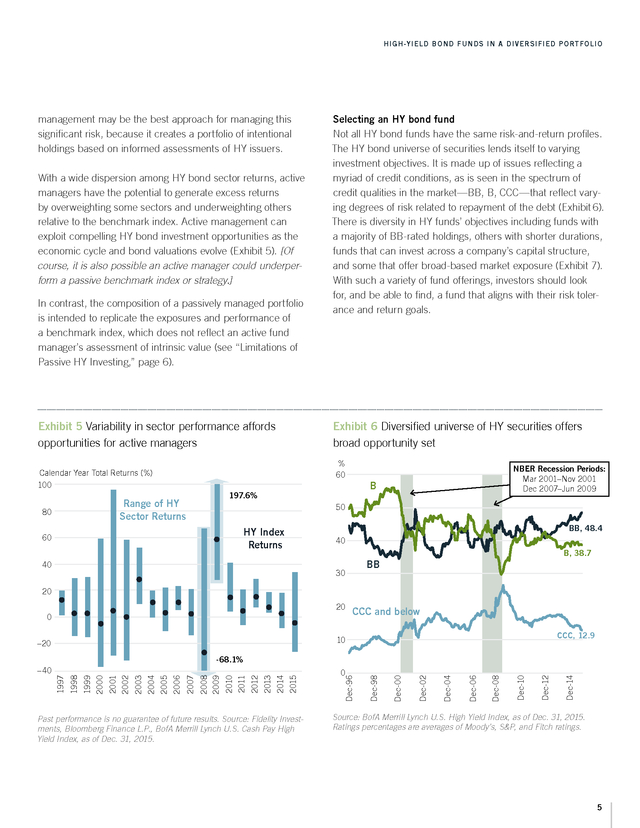
5) HIGH-YIELD BOND FUNDS IN A DIVERSIFIED PORTFOLIO management may be the best approach for managing this significant risk, because it creates a portfolio of intentional holdings based on informed assessments of HY issuers. With a wide dispersion among HY bond sector returns, active managers have the potential to generate excess returns by overweighting some sectors and underweighting others relative to the benchmark index. Active management can exploit compelling HY bond investment opportunities as the economic cycle and bond valuations evolve (Exhibit 5). [Of course, it is also possible an active manager could underperform a passive benchmark index or strategy.] In contrast, the composition of a passively managed portfolio is intended to replicate the exposures and performance of a benchmark index, which does not reflect an active fund manager’s assessment of intrinsic value (see “Limitations of Passive HY Investing,” page 6). Exhibit 5 Variability in sector performance affords opportunities for active managers Exhibit 6 Diversified universe of HY securities offers broad opportunity set % 60 Calendar Year Total Returns (%) 100 NBER Recession Periods: Mar 2001–Nov 2001 Dec 2007–Jun 2009 B 197.6% Range of HY Sector Returns 80 Selecting an HY bond fund Not all HY bond funds have the same risk-and-return profiles. The HY bond universe of securities lends itself to varying investment objectives. It is made up of issues reflecting a myriad of credit conditions, as is seen in the spectrum of credit qualities in the market—BB, B, CCC—that reflect varying degrees of risk related to repayment of the debt (Exhibit 6). There is diversity in HY funds’ objectives including funds with a majority of BB-rated holdings, others with shorter durations, funds that can invest across a company’s capital structure, and some that offer broad-based market exposure (Exhibit 7). With such a variety of fund offerings, investors should look for, and be able to find, a fund that aligns with their risk tolerance and return goals. 50 BB, 48.4 HY Index Returns 60 40 40 B, 38.7 BB 30 20 20 0 CCC and below CCC, 12.9 10 –20 Past performance is no guarantee of future results. Source: Fidelity Investments, Bloomberg Finance L.P., BofA Merrill Lynch U.S. Cash Pay High Yield Index, as of Dec. 31, 2015. Dec-14 Dec-12 Dec-10 Dec-08 Dec-06 Dec-04 Dec-02 Dec-00 Dec-98 0 Dec-96 2015 2013 2014 2012 2010 2011 2007 2008 2009 2006 2003 2004 2005 2001 2002 1999 2000 1997 1998 -68.1% –40 Source: BofA Merrill Lynch U.S. High Yield Index, as of Dec. 31, 2015. Ratings percentages are averages of Moody’s, S&P, and Fitch ratings. 5
6) leadership series MARCH 2 016 Limitations of passive HY investing: A passively managed portfolio maintains the industry allocations that closely mimic that of its benchmark index (see “Isn’t the HY Market All about Energy?” page 7). In other words, the sector allocations of a passive index fund are based on the current proportions of various industries within the benchmark—rather than on an active assessment of the merits of any one industry relative to another. • Passive ETFs often have to hold bonds with deteriorating fundamentals, whereas active managers can avoid/reduce the impact of credit deterioration in a portfolio. • The underlying HY bond indexes of HY passive strategies are capitalization weighted, and therefore predisposed to heavily weighting the largest HY debt issuers. In some instances, this can have a negative influence on index results. • In general, passive HY ETFs have experienced high trading levels and therefore high trading costs, which have eaten into returns. On an asset basis, HY ETFs have experienced more than twice the volatility in asset flows of HY mutual funds.2 Investors with longer investment horizons may benefit from investing in HY mutual funds, which historically have had a lower percentage of flows to assets and thus lower trading costs. 2  Source: Lipper, 2013 to 2015. HY bond funds: best aligned with long-term goals Investors that hold HY bond funds over a full market cycle may benefit from compounding of high income and potential appreciation as securities are called or mature at par. At points in a cycle, HY bonds are susceptible to bouts of volatility. As market conditions evolve, HY bond prices can become overvalued or undervalued for a variety of reasons— technical and fundamental. With a long-term active investment approach, an investor may be able to take advantage of these valuation opportunities. Additionally, the recovery years of HY bonds—those following an annual 6 decline—have tended to be good (often very good, Exhibit 3). By aligning HY bond fund holdings with long-term financial objectives, investors may avoid being forced to liquidate at an inopportune time to meet a financial need. The key is having a time frame that allows HY bond prices to recover. Summary HY bond funds have the capacity to add value to a diversified portfolio over the long term. While there is a spectrum of fund objectives within the HY bond fund category to consider, not all of them are created equal—income does not equal outcome. We believe actively managed HY funds are favorably differentiated by their potential to identify valuation opportunities over a market cycle while managing risk. Exhibit 7 Diversity of HY bond funds available to align with investor risk-and-return preferences Short Duration Income High Quality Income Core Income Opportunistic Income Investment Grade Investment Grade Investment Grade Investment Grade Sr. Secured Loans Sr. Secured Loans Sr. Secured Loans Sr. Secured Loans Secured Bonds Secured Bonds Secured Bonds Secured Bonds Sr. Unsecured Bonds Sr. Unsecured Bonds Sr. Unsecured Bonds Sr. Unsecured Bonds Subordinated Bonds Subordinated Bonds Subordinated Bonds Subordinated Bonds Convertible Bonds Convertible Bonds Convertible Bonds Convertible Bonds Preferred Stock Preferred Stock Preferred Stock Preferred Stock Common Stock Common Stock Common Stock Common Stock Primary Opportunistic Negligible Source: Fidelity Investments; for illustrative purposes only.
7) HIGH-YIELD BOND FUNDS IN A DIVERSIFIED PORTFOLIO Isn’t the HY market all about energy? Yes and no. Depending on the benchmark used, the energy sector accounted for 10% to 15% of the HY market at the end of December 2015 (Exhibit A). If other commodity-related issuers had been included, the total would have been in the 20% range. As with telecommunication companies in the 1990s and leveraged buyouts in the mid-2000s, energy is this cycle’s weak link. And in this instance, sentiment is unlikely to change until there is some stabilization in oil and natural gas prices. There are two reasons for some optimism. First, Exhibit A shows the energy sector is already pricing in its own recession and a 10% to 20% annual default rate over the next few years as implied by the option-adjusted spread. Second, with 80% of the HY market not related to commodities, there will eventually be a decoupling between energy prices and the overall HY market. At a spread of 695 basis points, the HY market is theoretically pricing in a default rate of 6% to 7%.1 That would be unprecedented for a U.S. HY market without a recession. 1  Source: BofA Merrill Lynch U.S. High Yield Constrained Index, as of Dec. 31, 2015. Exhibit A Energy issues represented nearly 11% of the HY index at the end of 2015. Market Value ($B) % of Energy Sector % of HY Index Yield-toWorst (%) Option- Adj. Spread (bps) 2015 Return (%) Exploration & Production 59.3 44.8 4.9 21 1,918 –36.12 Gas Distribution 43.9 33.1 3.6 9 712 –6.07 Oil Field Equipment & Services 22.2 16.7 1.8 18.9 1,713 –21.08 Oil Refining & Marketing 7.2 5.4 0.6 8.1 633 5.3 $132.50 100 10.90% 15.90% 1,415 –25.58 100.00% 8.77% 695 -4.61 Total Energy BofA ML U.S. HY Index $1,212.60 Yield to worst (%): The lowest potential yield that can be received on a bond without the issuer actually defaulting, calculated by using the lower of the yield to maturity and the yield to call on every call date. Option adjusted spread: the spread relative to a risk-free interest rate, usually measured in basis points (bps), that equates the theoretical present value of a series of uncertain cash flows of an instrument to its current market price. Bps: basis points. Past performance is no guarantee of future results. Source: BofA Merrill Lynch U.S. High Yield Constrained Index, as of Dec. 31, 2015. AUTHORS Matthew Conti l Portfolio Manager Matt Conti is a portfolio manager in the high-yield bond group of Fidelity Investments. In this role, Mr. Conti manages various high-yield bond portfolios and subportfolios. He joined Fidelity in 1995 as a high-yield analyst and has been a portfolio manager since 2000. Michael Cheng, CFA l Quantitative Analyst Michael Cheng is a quantitative analyst on the Equity & High Income Quantitative Research team at Fidelity Investments. In this role, Mr. Cheng is responsible for quantitative alpha research, idea screening, risk management, portfolio construction, and asset allocation research. He joined Fidelity in 1999. Scott Mensi l Director, Investment Product Scott Mensi is a director in the Investment Product Group at Fidelity Investments. Mr. Mensi is responsible for product strategy, development, management, and advocacy of Fidelity’s high-income portfolios. He joined Fidelity in 2011. Fidelity Thought Leadership Vice President Geri Sheehan, CFA, provided editorial direction. 7
8) leadership series MARCH 2 016 Lynch Current 10-Year U.S. Treasury Index measures the performance of Treasuries with at least 10 years remaining until maturity. © 2016 FMR LLC. All rights reserved. Citigroup 3-Month Treasury Bill Index is an unmanaged index that tracks short-term U.S. government debt instruments. 746573.1.0 The Credit Suisse Leveraged Loan Index tracks the investable market of the U.S.-dollar-denominated leveraged loan market. It consists of issues rated “5B” or lower, meaning that the highest rated issues included in this index are Moody’s/S&P ratings of Baa1/BB+ or Ba1/BBB+. All loans are funded term loans with a tenor of at least one year and are made by issuers domiciled in developed countries. For institutional investor or investment professional use only. Endnotes Exhibit 2 JANUARY 2006–DECEMBER 2015 Allocation Annualized S&P500 BarAgg HY Risk Return 49% 31% 20% 9.18 6.60 45% 35% 20% 8.55 6.48 60% 40% 0% 9.18 6.48 Source: Barclays, as of Dec. 31, 2015. NOVEMBER 1984–DECEMBER 2015 Allocation Annualized S&P500 BarAgg HY Risk Return 54% 26% 20% 9.45 9.90 52% 28% 20% 9.07 9.80 60% 40% 0% 9.45 9.80 Source: Barclays, as of Dec. 31, 2015. Option-adjusted spread is the spread relative to a risk-free interest rate, usually measured in basis points (bps), that equates the theoretical present value of a series of uncertain cash flows of an instrument to its current market price. Standard deviation shows how much variation there is from the average (mean or expected value). A low standard deviation indicates that the data points tend to be very close to the mean, whereas a high standard deviation indicates that the data points are spread out over a large range of values. A higher standard deviation represents greater relative risk. Excess return: the amount by which a portfolio’s performance exceeds its benchmark, net (in the case of the analysis in this article) or gross of operating expenses, in percentage points. Index Definitions BofA Merrill Lynch U.S. High Yield Bond Index is a market-capitalizationweighted index of U.S.-dollar-denominated, below-investment-grade corporate debt publicly issued in the U.S. domestic market. The BofA Merrill Lynch U.S. Cash Pay High Yield Index tracks the performance of U.S.-dollar-denominated, below-investment-grade corporate debt, currently in a coupon paying period, that is publicly issued in the U.S. domestic market. The BofA Merrill Lynch U.S. High Yield Constrained Index contains all securities in The BofA Merrill Lynch U.S. Cash Pay High Yield Index that are rated BB1 through BB3, based on an average of Moody’s, S&P and Fitch, but caps issuer exposure at 2%. The BofA Merrill 8 JPM® EMBI Global Index, and its country sub-indices, tracks total returns for the U.S.-dollar-denominated debt instruments issued by emerging market sovereign and quasi-sovereign entities, such as Brady bonds, loans, and eurobonds. Barclays U.S. Aggregate Bond Index is a broad-based, market-valueweighted benchmark that measures the performance of the investment grade, U.S.-dollar-denominated, fixed-rate taxable bond market. S&P 500® Index is a market-capitalization-weighted index of 500 common stocks chosen for market size, liquidity, and industry group representation to represent U.S. equity performance. S&P 500 is a registered service mark of Standard & Poor’s Financial Services LLC. Views expressed are as of the date indicated, based on the information available at that time, and may change based on market and other conditions. Unless otherwise noted, the opinions provided are those of the authors and not necessarily those of Fidelity Investments or its affiliates. Fidelity does not assume any duty to update any of the information. Investment decisions should be based on an individual’s own goals, time horizon, and tolerance for risk. Investors considering investments in bond funds should know that, generally speaking, the bond market is volatile, and fixed income securities carry interest rate risk. (As interest rates rise, bond prices usually fall, and vice versa. This effect is usually more pronounced for longer-term securities.) Fixed income securities also carry inflation risk and credit and default risks for both issuers and counterparties. Unlike individual bonds, most bond funds do not have a maturity date, so holding them until maturity to avoid losses caused by price volatility is not possible. Highyield/non-investment-grade bonds involve greater price volatility and risk of default than investment-grade bonds. Stock markets are volatile and can fluctuate significantly in response to company, industry, political, regulatory, market, or economic developments. Investing involves risk, including risk of loss. Past performance is no guarantee of future results. Diversification and asset allocation do not ensure a profit or guarantee against loss. All indices are unmanaged. You cannot invest directly in an index. Third-party marks are the property of their respective owners; all other marks are the property of FMR LLC. If receiving this piece through your relationship with Fidelity Institutional Asset Management (FIAM), this publication is provided to investment professionals, plan sponsors, and institutional investors by Fidelity Investments Institutional Services Company, Inc., and for certain institutional investors by Pyramis Distributors Corporation LLC. If receiving this piece through your relationship with Fidelity Personal & Workplace Investing (PWI), Fidelity Family Office Services (FFOS), or Fidelity Institutional Wealth Services (IWS), this publication is provided through Fidelity Brokerage Services LLC, Member NYSE, SIPC. If receiving this piece through your relationship with National Financial or Fidelity Capital Markets, this publication is for institutional investor use only. Clearing and custody services are provided through National Financial Services LLC, Member NYSE, SIPC.