Severity: Notice
Message: Undefined variable: content_category
Filename: user/transcript.php
Line Number: 106
Severity: Warning
Message: Invalid argument supplied for foreach()
Filename: user/transcript.php
Line Number: 106


1) Informed Options Trading prior to M&A Announcements: Insider Trading?∗ Patrick Augustin† Menachem Brenner‡ Marti G. Subrahmanyam§ McGill University, Desautels New York University, Stern New York University, Stern First Draft: September 2013 This Draft: May 2014 Abstract We investigate informed trading activity in equity options prior to the announcement of corporate mergers and acquisitions (M&A). For the target companies, we document pervasive directional options activity, consistent with strategies that would yield abnormal returns to investors with private information. This is demonstrated by positive abnormal trading volumes, excess implied volatility and higher bid-ask spreads, prior to M&A announcements. These effects are stronger for out-of-the-money (OTM) call options and subsamples of cash offers for large target ï¬rms, which typically have higher abnormal announcement returns. The probability of option volume on a random day exceeding that of our strongly unusual trading (SUT) sample is trivial - about three in a trillion. We further document a decrease in the slope of the term structure of implied volatility and an average rise in percentage bid-ask spreads, prior to the announcements. For the acquirer, we provide evidence that there is also unusual activity in volatility strategies. A study of all Securities and Exchange Commission (SEC) litigations involving options trading ahead of M&A announcements shows that the characteristics of insider trading closely resemble the patterns of pervasive and unusual option trading volume. Historically, the SEC has been more likely to investigate cases where the acquirer is headquartered outside the US, the target is relatively large, and the target has experienced substantial positive abnormal returns after the announcement. Keywords: Asymmetric Information, Civil Litigations, Insider Trading, Mergers and Acquisitions, Market Microstructure, Equity Options, SEC JEL Classiï¬cation: C1, C4, G13, G14, G34, G38, K22, K41 ∗ We thank Yakov Amihud, Rohit Deo, Vic Khanna, Denis Schweizer, David Yermack, Zvi Wiener, Fernando Zapatero and seminar participants at the 2013 OptionMetrics Research Conference, the NYU Stern Corporate Governance Luncheon, the Penn-NYU Conference on Law and Finance, the CFA-JCF-Shulich Conference on Financial Market Misconduct, McGill University, the Luxembourg School of Finance and the 2014 Jerusalem Finance Conference for helpful comments and suggestions. We thank NERA Economic Consulting for sharing their data and we are also grateful to Yinglu Fu for outstanding research assistance. All errors remain our own. † McGill University - Desautels Faculty of Management, 1001 Sherbrooke St. West, Montreal, Quebec H3A 1G5, Canada. Email: Patrick.Augustin@mcgill.ca. ‡ New York University - Leonard N. Stern School of Business, 44 West 4th St., NY 10012-1126 New York, USA. Email: mbrenner@stern.nyu.edu. § New York University - Leonard N. Stern School of Business, 44 West 4th St., NY 10012-1126 New York, USA. Email: msubrahm@stern.nyu.edu.
2) 1 Introduction The recent leveraged buyout announcement of H.J. Heinz Inc. by an investor group consisting of Berkshire Hathaway Inc., controlled by Warren Buffett, and 3G Capital, a Brazilian privateequity ï¬rm, has sparked concerns about unusual option activity prior to the deal announcement. Was this abnormal volume in the options of Heinz Inc. an indication of trading based on insider information? Apparently the US Securities and Exchange Commission (SEC) thought so, alleging that a brokerage account in Switzerland was used for illegal insider trading. Another noteworthy case from an earlier period is the merger of Bank One with JP Morgan (JPM) Chase in 2004, in which one investor was alleged to have bought deep out-of-the-money (DOTM) calls just (hours) before the announcement. While these cases received considerable publicity, they are by no means isolated cases of such activity. Indeed, while the SEC has taken action in several cases where the evidence was overwhelming, one can assume that there are many more cases that go undetected, or where the evidence is not as clear-cut, in a legal/regulatory sense.1,2 Academic research on the role of informed trading in equity options around major news events, and, in particular, the announcements of mergers and acquisitions (M&A), has been scanty.3 We aim to ï¬ll this gap with the research presented in this paper. The objective of our study is to investigate and quantify the pervasiveness of informed trading, at least partly based on inside information, in the context of M&A activity in the US. To this end, we conduct a forensic analysis of the volume, implied volatility, and bid-ask spreads of options over the 30 days preceding the formal announcement of acquisitions.4 We focus on the target companies in M&A transactions, but also provide some preliminary evidence pertaining to the acquirers. More speciï¬cally, we examine option trading volumes (and prices and bid-ask spreads) prior to M&A announcements in the US from January 1, 1996 through December 31, 2012. We show that abnormal options activity prior to M&A announcements is consistent with strate1 Although the JPM/Bank One case received a lot of attention in the press, we are puzzled as to why this case does not appear in the SEC investigation/litigation ï¬les. However, we do document a large number of other SEC cases during our sample period. 2 See, for example, “Options Activity Questioned Again” in the Wall Street Journal, February 18, 2013. 3 Related cases of insider trading activity prior to earnings announcements, and other important corporate announcements, have received somewhat greater attention. 4 We examine alternative strategies that may yield abnormal returns to informed traders. The focus is on option strategies, although some of these may also involve trading in the underlying stocks. See the Internet appendix for details. 1
3) gies that would a priori lead to higher abnormal returns for investors with material non-public information: abnormal options trading volume that is particularly pronounced for short-dated, out-of-the-money (OTM) call options. This activity is associated with price and liquidity changes that are expected in the presence of an unusual trading volume with greater asymmetric information: excessive implied volatility, an attenuation of the term structure of implied volatility, and an increase in bid-ask spreads. We further show that no such patterns exist for any randomly chosen announcement dates, neither in the volume, nor in the prices or liquidity. Thus, if there is no (privately) expected increase in the target’s stock price, we do not generally observe abnormal options activity that would be consistent with trading by privately informed investors. From an academic point of view, options trading around M&As is a particularly attractive laboratory for the testing of hypotheses pertaining to insider trading, for several reasons. For one thing, M&A announcements are publicly unexpected events, in terms of timing and even occurence. Thus, on average, we should not be able to distinguish options trading activity before an announcement from that occurring on any randomly chosen date. In contrast to other corporate announcements, such as quarterly earnings announcements, M&As are likely the closest we can get to a truly unexpected event, while still allowing us to construct a meaningful sample. Second, the nature of private information is clearly identiï¬ed: a signiï¬cant rise in the target’s stock price upon the announcement in virtually all cases. This enables us to formulate clear hypotheses that we should fail to reject if informed trading is truly pervasive. Third, the richness of our options data, with detailed information regarding a large number of underlying stocks for multiple strike prices and expiration dates, is especially useful for formulating hypotheses about informed trading across several dimensions. We document evidence of a statistically signiï¬cant average abnormal trading volume in equity options written on the target ï¬rms in the US over the 30 days preceding M&A announcements. Approximately 25% of all the cases in our sample have abnormal volumes that are signiï¬cant at the 5% level, and for 15% the signiï¬cance is at a 1% level. The proportion of cases with abnormal volumes is relatively higher for call options (26%) than for put options (15%). Stratifying the results by “moneyness”, we ï¬nd that there is signiï¬cantly higher abnormal trading volume (both in average levels and frequencies) in OTM call options compared to at-the-money (ATM) and in-the-money 2
4) (ITM) calls.5,6 We also ï¬nd that ITM puts, as well as OTM puts, trade in larger volumes than ATM puts. This is strong evidence that informed traders may not only engage in OTM call transactions, but possibly also ITM put transactions.7 In addition to evidence of abnormal trading volumes in anticipation of M&A announcements, we provide statistical evidence that the two-dimensional volume-moneyness distribution shifts signiï¬cantly, to OTM call options with higher strike prices, over the 30 days prior to the announcement day. In order to distinguish informed trading from random speculative bets, we focus our attention on a subset of transactions, in which the informed trading is likely to be concentrated: low-priced options, trading just prior to the announcement and expiring just after it, with non-zero trading volumes. In these cases, the results are even sharper. We show that these trades are signiï¬cantly different from a randomly chosen matching sample on any other date, the probability of the unusual volume in the sample arising out of chance being about three in a trillion. We also exploit the low liquidity in equity options to quantify the pervasive unusual trading activity. More precisely, we quantify the likelihood that a sudden and signiï¬cant spike in the equity option trading volume, prior to a major informational event but following an extended period of no trading, is based on informed trading, rather than being random. The chance of observing a greater proportion of non-zero-volume observations on a random date is, at best, one in a million. We further provide statistical tests of positive excess implied volatility for target ï¬rms in the pre-event window. Thus, the relatively higher abnormal volumes in OTM call options for the targets translate, on average, into an increase in the implied volatility prior to the announcement day.8 Similarly, informed trading has an impact on equity option prices and leads to an attenuation of the term structure of implied volatility for target ï¬rms. We also ï¬nd that the percentage bid-ask spread for options on target ï¬rms rises from an average of 45% (35%) to 55% over the 30 (90) days preceding the announcement. This effect is signiï¬cant for DOTM and OTM call options, as well 5 The average cumulative abnormal volume in OTM call options is approximately 2,700 contracts greater than that in ATM call options, and 2,100 contracts greater than that in ITM call options. 6 It is shown in Internet appendix A that a wide variety of strategies for exploiting private information about an acquisition result in trading OTM calls or ITM puts. 7 As discussed later, and analyzed in detail in Internet Appendix A, it is unclear whether informed traders would take long or short positions in call and put options, since replication involving the underlying stock as well as the option can change the directional beneï¬ts of such trades. 8 It is important to note that there are many cases where the abnormal volume is not preceded by excess implied volatility, as discussed below. 3
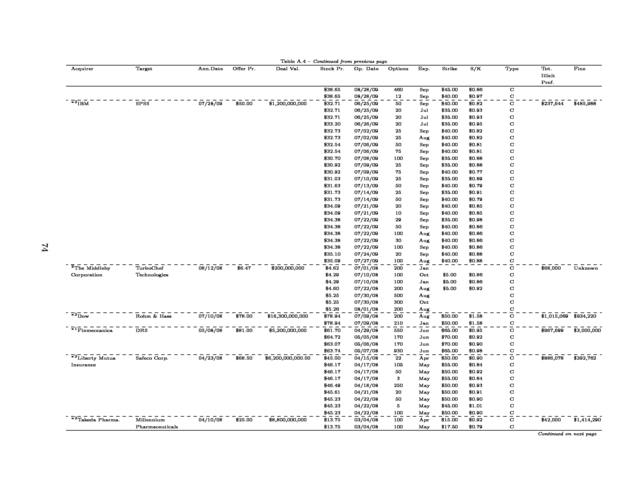
5) as short- to medium-dated options. We show that informed trading is more pervasive in cases of target ï¬rms receiving cash offers, and less so when the target is being taken private as a result of the deal. We then explore the sub-sample of larger target ï¬rms receiving cash offers, and show that the effects documented in the overall sample are accentuated for these ï¬rms. We provide preliminary evidence for acquirer ï¬rms, for which informed traders would bet on an increase in jump risk, up or down, and engage in long-gamma strategies. We show that there is a statistically signiï¬cant increase in the trading volume of ATM options on the acquirer, ahead of the announcement of the acquisition. We then study the cases in which the SEC conducted an investigation into illegal insider trading ahead of M&A announcements, and ï¬nd that the SEC is likely to examine cases where the targets are large and experience substantial abnormal returns after the announcement, and where the acquirers are headquartered outside the US. The characteristics of the litigation sample closely resemble the anomalous statistical evidence we ï¬nd to be pervasive and non-random in a representative sample of M&A transactions. In particular, we persistently observe insider trades in short-dated and OTM call options initiated, on average, 16 days before the announcement. Yet, the modest number of civil lawsuits for insider trading in options made by the SEC appears small in comparison to the pervasive evidence we document. This paper provides a forensic analysis of trading volume and implied volatility for equity options, focusing on target ï¬rms involved in M&A announcements. It suggests a natural classiï¬cation scheme based on volume and price attributes that may be useful for regulators and prosecutors looking to detect insider trading activity. The structure of the paper is as follows. In Section 2, we provide a review of the relevant literature. We describe the data selection process and review the basic summary statistics in Section 3. The main hypotheses and methodology are presented in Section 4. We analyze the results for targets in the various subsections of Section 5.1. Section 5.2 deals with the acquirer sample. In Section 6 we provide an analysis of the SEC sample. We end with a summary and conclusions in Section 7. 4
6) 2 Literature Review Our work relates generally to the theoretical literature studying when and how informed agents choose to trade in the options market in the presence of, for instance, asymmetric information (Easley, O’Hara, and Srinivas (1998)), differences in opinion (Cao and Ou-Yang (2009)), short-sale constraints (Johnson and So (2012)), or margin requirements and wealth constraints (John, Koticha, Narayanan, and Subrahmanyam (2003)). More speciï¬cally, our objective is to identify informed, or even insider, trading in the options market ahead of unexpected public announcements, such as M&As. In this spirit, Poteshman (2006) concludes that informed investors traded put options ahead of the 9/11 terrorist attack. Keown and Pinkerton (1981) conï¬rm the leakage of information and excess stock returns earned through insider trading in the presence of merger announcements, but they do not investigate equity option activity. Meulbroek (1992) studies the characteristics of a sample of illegal insider trading cases detected and prosecuted by the SEC from 1980 to 1989, but likewise does not focus on option trading. Acharya and Johnson (2010) show that, for leveraged buyouts, the presence of more insiders leads to greater levels of insider activity, in the sense that a larger number of equity participants in the syndicate is associated with greater levels of suspicious stock and option activity.9 Chesney, Crameri, and Mancini (2011) develop statistical methods with ex-ante and ex-post information to detect informed option trades in selected industries and companies, conï¬rming that informed trading tends to cluster before major informational events. Our research relates more closely to Wang (2013), who investigates unusual option volume and price activity ahead of M&A announcements and questions how such activity predicts SEC litigation. In contrast, we study unusual option activity in much greater depth, use more sophisticated statistical techniques, and formulate more detailed and precisely stated hypotheses involving option strategies. We are also more exhaustive in our analysis of the information obtained from handcollected SEC litigation ï¬lings. While Frino, Satchell, Wong, and Zheng (2013) also hand-collect SEC litigation reports and study the determinants of illegal insider trading, they focus on stocks, not options as we do. Our paper also speaks to the literature that investigates the informational content of option trading volumes ahead of M&As for post-announcement abnormal stock returns. Cao, Chen, and 9 Acharya and Johnson (2007) also provide evidence of insider trading in the credit derivatives market. 5
7) Griffin (2005), for example, ï¬nd evidence that, for the target companies in M&A transactions, the options market displaces the stock market for information-based trading during the periods immediately preceding takeover announcements, but not in normal times.10 Focusing on the acquirer ï¬rms, Chan, Ge, and Lin (2014) provide evidence that the one-day pre-event implied volatility spread and the implied volatility skew, two proxies for informed option trading, are, respectively, positively and negatively associated with acquirer cumulative abnormal returns.11 The predictive power of both measures increases if the liquidity of the options is high relative to that of the underlying stocks. Barraclough, Robinson, Smith, and Whaley (2012) exploit the joint information set of stock and option prices to disentangle synergies from news in M&A transaction announcements. They also document that the increase in trading volume from the pre-announcement period to the announcement day is most dramatic for call options, with an increase of 212.3% for bidder call options, and an increase of 1,619.8% for target call options. We provide more granular evidence on the changes in the distribution of volume for different levels of option moneyness, ahead of announcements, which is worth examining in greater detail since the results presented in the literature are inconsistent across studies.12 Podolski, Truong, and Veeraraghavan (2013) also provide some indirect evidence that the option-to-stock volume ratio increases in the pre-takeover period, and increases relatively more for small deals that are less likely to be detected. Evidence of informed trading and the role of options markets in revealing information around M&A announcements, from the UK equity and options market, is provided by Spyrou, Tsekrekos, and Siougle (2011). Finally, Nicolau (2010) studies the behavior of implied volatility around merger announcements, and interprets positive abnormal changes in implied volatility prior to an announcement as evidence of information leakage. While the bulk of the empirical research on options markets focuses on index options, there 10 More speciï¬cally, the authors study a sample of 78 US merger or takeover ï¬rms between 1986 and 1994. Buyerseller-initiated call-volume imbalances, but not stock imbalances, are associated with higher stock returns the following day. However, during periods of normal trading activity, only buyer-seller-initiated stock-volume imbalances exhibit predictability, while option volume is uninformative. Option volume imbalances before M&A transactions are concentrated in ï¬rms that eventually have successful takeovers, and cannot be explained by target ï¬rm characteristics. 11 Chan, Ge, and Lin (2014) use a sample of 5,099 events relating to 1,754 acquirers, over the period 1996 to 2010. The implied volatility spread is calculated as the average difference between the implied volatilities of call and put options on the same security with the same strike and maturity. The implied volatility skew is calculated as the difference between the implied volatilities of OTM puts and ATM calls. 12 Poteshman (2006) focuses only on put options, Chesney, Crameri, and Mancini (2011) argue that there is more informed trading in put options, while Wang (2013) argues that there is higher abnormal volume for ATM call options. 6
8) are fewer studies using equity options (i.e., options on individual stocks), although they had been trading for almost a decade prior to the introduction of index options in the US.13 There are even fewer studies relating to informed trading around major informational events such as M&As, using option strategies, and those that exist are typically based on relatively small datasets. Even these studies tend to focus on either the target or the acquirer. In contrast, we study the trading patterns in the equity options of both the target and the acquirer, using data on both trading volumes and prices, highlighting the fundamental differences for insiders between directional and non-directional strategies. More speciï¬cally, we focus on the behavior of the entire volume distribution and the option-implied volatility across the depth-inthe-money dimension, prior to takeover announcements. Importantly, while some papers in the previous literature have investigated the informational content of option trading volumes for postannouncement stock returns, none of them have focused on the role of alternative option strategies in illegal insider trading. Moreover, in contrast to the above studies, which focus on various aspects of the M&A announcements using option data, our study focuses on the extent to which informed trading, possibly illegal, can be detected through the analysis of various option strategies, using both puts and calls in the target company and the acquirer. The likelihood of informed trading in these cases is explicitly quantiï¬ed in our analysis, and so too are the types of transaction - e.g., cash deals - that are particularly susceptible to such activity. Our study is also more comprehensive in scope than the above mentioned studies, is based on a much larger sample and uses rigorous statistical tests. A unique feature of our research is that we provide a detailed analysis of all the cases prosecuted by the SEC relating to insider trading in options prior to M&A announcements during the period of our study, and link them to our analysis of abnormal activity. 3 Data Selection and Summary Statistics The data for our study come from three primary sources: the Thomson Reuters Securities Data Company Platinum Database (SDC), the Center for Research in Securities Prices (CRSP) and OptionMetrics. The start date of our sample period is dictated by the availability of option infor13 The main constraint in the earlier period was the unavailability of complete data, which has changed dramatically with the advent of OptionMetrics as a reliable source for academic research in this area. 7
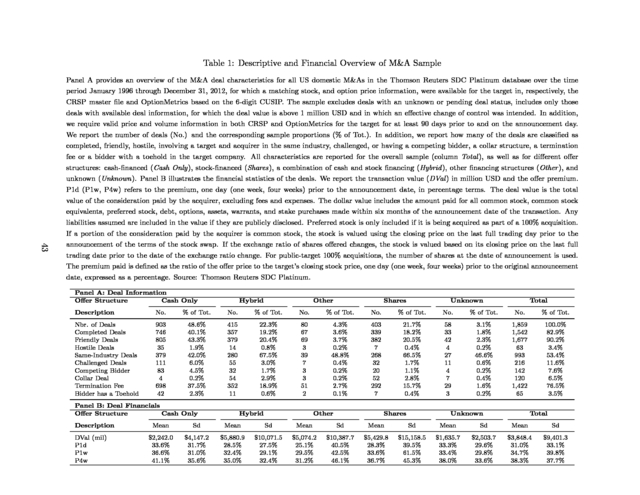
9) mation in OptionMetrics, which initiated its reporting on January 1, 1996. We begin our sample selection with the full domestic M&A dataset for US targets from SDC Platinum over the time period from January 1996 through December 2012. Our ï¬nal sample consists of 1,859 corporate transactions, for which we could identify matching stock and option information for the target. These deals were undertaken by 1,279 unique acquirers on 1,669 unique targets.14 For a subsample of 792 transactions, option information is available for both the target and the acquirer. We restrict our sample to deals aimed at effecting a change of control. In other words, to be included in our sample, the acquirer needs to have owned less than 50% of the target’s stock before the transaction, and to have been seeking to own more than 50% after the transaction. Hence, we include only mergers, acquisitions, and acquisitions of majority interest in our sample, thereby excluding all deals that were acquisitions of partial interest/minority stake purchases, acquisitions of remaining interest, acquisitions of assets, acquisitions of certain assets, recapitalizations, buybacks/repurchases/self-tender offers, and exchange offers. In addition, we exclude deals for which the status is pending or unknown, i.e., we only include completed, tentative or withdrawn deals. Next, we require information to be available on the deal value, and eliminate all deals with a transaction value below 1 million USD. Finally, we match the information from SDC Platinum with the price and volume information for the target in both CRSP and OptionMetrics. We require a minimum of 90 days of valid stock and option price and volume information on the target prior to, and including, the announcement date.15 We retain all options expiring after the announcement date and short-dated options expiring before the announcement date, as long as they are ATM. All matches between SDC and CRSP/OptionMetrics are manually checked for consistency based on the company name.16 Panel A in Table 1 reports the basic characteristics for the full sample, for which we require option information availability only for the target. Pure cash offers make up 48.6% of the sample, followed by hybrid ï¬nancing offers with 22.3%, and share offers with 21.7%. 82.9% of all transactions 14 Thus, 190 of the targets were involved in an unsuccessful merger or acquisition that was ultimately withdrawn. However, we include these cases in our sample, since the withdrawal occurred after the takeover announcement. 15 In other words, we also require the availability of long- and medium-dated options expiring after the event date. 16 Overall, we extract up to a maximum of one year of stock and option price information before and after the announcement date. The cut-off of one year is arbitrary, but follows from the trade-off of the following two objectives: having a sufficiently long time series before the announcement day to conduct an event study analysis, and keeping the size of the dataset manageable to minimize computational complexity. 8
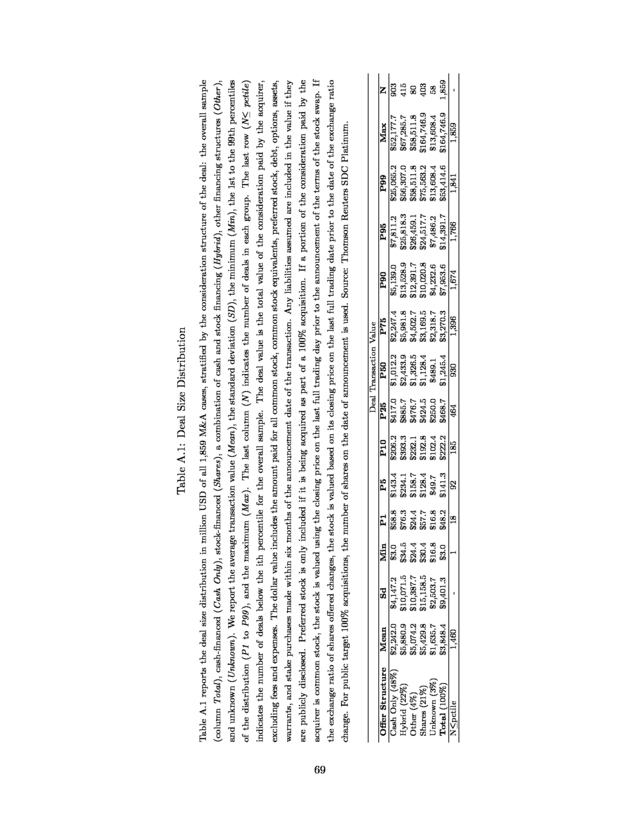
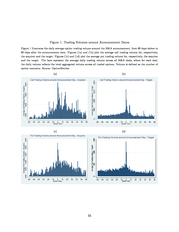
10) are completed, and mergers are mostly within the same industry, with 53.4% of all deals being undertaken with a company in the same industry based on the two-digit SIC code. 90.2% of all deals are considered to be friendly and only 3.4% are hostile, while 11.6% of all transactions are challenged.17 For a small subsample of 6.5% of the deals, the contracts contain a collar structure, 76.5% of all deals contain a termination fee, and in only 3.5% of the transactions did the bidder already have a toehold in the target company. Panel B shows that the average deal size is 3.8 billion USD, with cash-only deals being, on average, smaller (2.2 billion USD) than stock-only transactions (5.4 billion USD).18 The average one-day offer premium, deï¬ned as the excess of the offer price relatively to the target’s closing stock price, one day before the announcement date, is 31%. Statistics for the subsample for which we have option information on both the target and the acquirer are qualitatively similar. In Figure 1, we plot the average option trading volume in calls and puts for both the target and the acquirer, from 60 days before to 60 days after the announcement date. The increase in volume is a ï¬rst indication of information leakage prior to the public news announcements. There are two preliminary observations that can be made based on this cursory analysis. First, the unusual activity in the options of the target ï¬rm, is concentrated in a very narrow window around the announcement day, and occurs in both calls and puts. Second, the trading activity in the options of the acquirer ï¬rm is more dispersed, though most of it takes place close to the announcement day. However, these simple averages mask signiï¬cant cross-sectional differences in abnormal trading volumes across ï¬rms and options. A more detailed analysis is provided in Section 5, the empirical section that follows the discussion of our hypotheses. 4 Research Questions and Hypotheses We attempt to quantify the likelihood of informed trading by focusing on the trading activity in the options of both the target and the acquirer. Our analysis is focused on three different aspects of this broad issue: information obtained from the trading volume of options, information obtained from the option prices of these companies, and information from market microstructure effects. We 17 In the more recent past, there has been a dramatic increase in the number of deals that have been challenged by investors. See “First Rule of Mergers: To Fight Is to Lose”, in the Wall Street Journal, March 27, 2014. 18 Table A.1 in the Internet appendix provides more granular statistics on the deal size distribution. 9
11) investigate several hypotheses to test for such informed trading activity, mainly pertaining to the target ï¬rm.19 We emphasize in our hypotheses that an informed trader would pursue directional strategies for the target ï¬rm as the stock price almost always goes up after an announcement. On the other hand, for the acquirer, an informed trader would be more likely to pursue “volatility” trading strategies, as there is generally more uncertainty associated with the post-announcement direction of the stock price of the acquiring ï¬rm.20 The underlying assumption for all these hypotheses is that insiders are capital-constrained and would like to ensure that their private information is not revealed to the market prior to the trades, to minimize market impact.21 Also, in our analysis of potential strategies used by insiders, we do not explicitly consider the concern that this trading activity may be detected by the regulators, and how that may affect traders’ choice of strategies. We ï¬rst state and justify our hypotheses regarding the target ï¬rms and then discuss the hypothesis pertaining to the acquiring ï¬rms. 4.1 Target ï¬rms • H1: There is evidence of positive abnormal trading volume in equity options written on the target ï¬rms, prior to M&A announcements. If informed trading is present, but there is no leakage of information, informed traders should beneï¬t relatively more from strategies that use options, due to the leverage they can obtain from them, if they are capital-constrained. A takeover announcement is generally associated with a stock price increase for the target, usually a signiï¬cant one (for a survey, see Andrade, Mitchell, and Stafford (2001), for example). A trader who obtains prior knowledge 19 We write these hypotheses as statements of what we expect to ï¬nd in the data, rather than as null hypotheses that we would expect to be rejected. 20 This argument should be especially true for cash deals. While deals involving an exchange of stocks result in a decline of about 3% of the acquirer’s stock price, cash deals (48% of our sample) do not, on average, result in a decline, and there is considerable cross-sectional variation around these numbers. See Savor and Lu (2009), for example. 21 The informed trader faces the trade-off between transacting in the more liquid stock, where his trades are less likely to be discovered, or in the options market that provides more leverage, but where the chance of a price impact is greater. We do not analyze the stock market directly, but as long as capital constraints are binding, informed investors will, at least partly, migrate to the options market (see John, Koticha, Narayanan, and Subrahmanyam (2003)). Cao and Ou-Yang (2009) argue that speculative trading will occur in the options market mainly around major informational events if investors disagree about the future value of stock prices. Therefore, our focus, in this paper, is on informed trading in the options market. Nevertheless, we show in Figure A.1 of the Internet appendix that there is a strong increase in the ratios of call-to-stock volume and call-to-put volume, but only a modest increase in the ratio of put-to-stock volume. Detailed analysis of the question of whether informed trading is greater in the options market than in the stock market is left for future research. 10
12) of an upcoming deal and intends to use this information to trade is likely, given his capital constraints, to at least partly engage in leveraged trading strategies that will maximize his proï¬ts. The obvious venue for such activity is the options market, where we would expect to see signiï¬cant abnormal trading volumes in options for the target ï¬rms in anticipation of major corporate takeover announcements. Given the importance of leverage, we can sharpen the above hypothesis as follows in Hypothesis H2. • H2: The ratios of the abnormal trading volumes in (a) OTM call options to ATM and ITM call options, and (b) ITM put options to ATM and OTM put options, written on the target ï¬rms, are higher prior to M&A announcements. In the presence of superior information, a trading strategy involving the purchase of OTM call options should generate signiï¬cantly higher abnormal returns, as a consequence of the higher leverage (“more bang for the buck”). Hence, we expect a relatively larger increase in abnormal trading volume for OTM calls relative to ATM and ITM calls, in the presence of superior information.22 Moreover, an insider, taking advantage of his privileged knowledge of the direction of the target’s stock price evolution, is also likely to increase the trading volume through the sale of ITM puts, which will become less valuable when the announcement is made, followed by an upward move in the stock price of the target. An alternative strategy, arising from put-call-parity, would be to buy ITM puts coupled with the underlying stock, ï¬nanced by borrowing (mimicking the strategy of buying OTM calls). A possible reason for engaging in such a strategy rather than the more obvious one of buying OTM calls could be the lack of liquidity in OTM calls: a large order may have a signiï¬cant market impact and even reveal the information to the market. Thus, an abnormally high volume in ITM puts may result from either the strategy of mimicking the purchase of OTM calls or the strategy of taking a synthetic long position in the stock. One possibility is that an informed trader may engage in more complicated trading strategies to hide his intentions. However, it turns out that, irrespective of which alternative trading strategy is applied, we should observe abnormal trading volume in OTM call and/or ITM 22 This possibility corresponds to the case study of JPM-Chase merging with Bank One, which exhibits such a pattern. 11
13) put options.23 Ex ante, it is not clear whether the trading strategies should effectively result in “buys” or “sells” of OTM calls and ITM puts. This is, however, not a concern as OptionMetrics only reports the unsigned trading volume. Thus, our hypothesis that we should observe relatively higher trading volumes in OTM calls and potentially ITM puts encompasses a rich analysis of multiple trading strategies. • H3: There is positive excess implied volatility for equity options written on the target ï¬rms, prior to M&A announcements. Informed traders who have accurate information about the timing of an announcement and the offer price will tend to buy OTM calls just prior to the announcement (for example, as in the JPM-Bank One case). To obtain leverage, they will buy OTM calls that are likely to become ITM when the stock price reaches or exceeds the takeover offer price. If they are conï¬dent about their information, they will be willing to pay the offer price of the option market-maker, typically the seller of such options. Informed traders who anticipate a deal, but are uncertain of the offer price and the timing, will typically buy options that are closer to the money, and will also be willing to pay the offer price. Assuming that the equilibrium price of the option is, on average, between the bid and ask prices, buying at the ask price will result directly in higher excess volatility.24 The wider is the bid-ask spread, the greater will be the measured excess volatility, due to the convexity of option prices. Thus, we anticipate excess implied volatility, albeit not especially large, for all options on the target. • H4 : The percentage bid-ask spread for options written on target ï¬rms widens prior to M&A announcements. Similarly to the rationale behind Hypothesis H3, there should be no pattern in the bid-ask spread for the options on the target ï¬rm as the announcement date approaches, in the absence of insider activity. An increase in the percentage bid-ask spread conditional on abnormal trading volumes would be a natural response of the market-makers to such asymmetric in23 For a detailed analysis of alternative directional trading strategies that should result in abnormal volumes of OTM calls and/or ITM puts, see Internet Appendix A. 24 This argument can be related to prior work on the inelasticity of the option supply curve, along the lines analyzed theoretically by Garleanu, Pedersen, and Poteshman (2009) and empirically by Bollen and Whaley (2004) and Deuskar, Gupta, and Subrahmanyam (2011). 12
14) formation. This would be indirect evidence that there were informed traders in this market prior to the announcement date, but not necessarily that the information about a potential merger had leaked to the whole market. • H5: The (right) skewness of the option smile/skew, for target ï¬rms, increases prior to M&A announcements. Considering Hypotheses H2, H3, and H4, we expect that the demand for OTM call options, especially where the buyers pay the offer price, could increase the price of OTM call options relative to the price of OTM puts.25 If the implied volatility/strike price graph is initially a “smirk”, it should become “flatter” due to the actions of an informed trader. On the other hand, if the graph is more like a “smile”, we should observe a steeper smile on the right-hand side due to these informed trades. • H6: The term structure of implied volatility decreases for options on the target ï¬rms before takeover announcements. Informed traders can obtain the highest leverage by buying short-dated OTM call options, that expire soon after the announcement date. Given this preference, demand pressure on short-dated options should lead to a relative price increase (or a tendency to buy at the offer price) in options with a shorter time to expiration, compared to long-dated options. Thus, the term structure of implied volatility should decrease for call options written on target ï¬rms. 4.2 Acquirer ï¬rms • H7: In anticipation of major news events, there is a volume increase in long-gamma trading strategies for acquirer ï¬rms prior to M&A announcements. As explained above, since, in the case of the acquirer, there is general uncertainty regarding the direction in which the price of the stock will move after the announcement, an informed trader will not make a directional trade using OTM options. Rather, he will trade on the possibility of a jump in the stock price of the acquirer in either direction. The obvious strategy to use to take advantage of this information would be a high-gamma strategy, e.g., buying 25 The change in the skewness of the option smile/skew would also depend on the extent to which ITM puts were dominated by buyers or sellers, as argued in H2. 13
15) ATM straddles. Thus, we anticipate an increase in the volume of ATM straddles. As stated above, this is likely to be particularly true for cash deals, which comprise a little less than half of our sample. In stock-ï¬nanced deals, on average, there is a decline of 3% in the acquirer’s stock price. Though there are a number of such cases where there is no decline or even an increase, the insider may employ a directional strategy or a mixed one (directional/volatility) for these deals, due to the negative average. 5 Empirical Analysis 5.1 Target Firms We investigate the ï¬rst six hypotheses along the three dimensions identiï¬ed above: the trading volume, price and liquidity (bid-ask spread) of options traded on target ï¬rms. We begin by looking into the behavior of volume, prior to the M&A announcement dates. 5.1.1 Abnormal Volume In order to address Hypotheses H1 and H2, we conduct a forensic analysis of the trading volume in equity options during the 30 days preceding takeover announcements. We ï¬rst summarize the descriptive statistics of the option trading volume in our sample. We then test for the presence of positive abnormal volumes in call and put options across moneyness categories, using a variation of the conventional event-study methodology. Next, we formally test, using an approximation to the bivariate Kolmogorov-Smirnov test, whether the entire volume-moneyness distribution shifts in anticipation of takeover news releases, i.e., whether there is an increase in the OTM call volume relative to ATM and ITM calls as we approach the event day. We next look at speciï¬c trades that are most susceptible to insider trading, and compare them to a matched random sample. We also examine the prevalence of zero-volume runs (“conditional trading volume”) in the periods before announcements in comparison to a sample preceding a random date. Finally, we use regression analysis to infer the characteristics of the cumulative abnormal volume, which leads us to a deeper analysis of the subsample of cash-ï¬nanced deals. • A. Statistics of the Equity Option Trading Volume 14
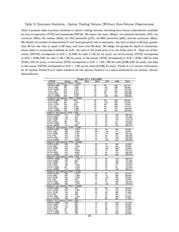
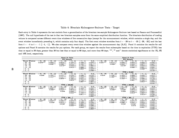
16) We start by reporting basic summary statistics for the option trading volumes of the target ï¬rms, stratiï¬ed by time to expiration and moneyness, in Table 2.26 We classify our sample into three groups in terms of time to expiration: less than or equal to 30 days, greater than 30 days but less than or equal to 60 days, and more than 60 days. In addition, we sort the observations into ï¬ve groups of moneyness, where moneyness is deï¬ned as S/K, the ratio of the stock price S to the strike price K. DOTM corresponds to S/K ∈ [0, 0.80] for calls ([1.20, ∞) for puts), OTM corresponds to S/K ∈ (0.80, 0.95) for calls ([1.05, 1.20) for puts), ATM corresponds to S/K ∈ (0.95, 1.05) for calls ((0.95, 1.05) for puts), ITM corresponds to S/K ∈ [1.05, 1.20) for calls ((0.80, 0.95] for puts), and DITM corresponds to S/K ∈ [1.20, ∞) for calls ([0, 0.80] for puts). Panels A to C report summary statistics for all options in the sample, while Panels D to F and G to I report the numbers separately for calls and puts, respectively. First, regardless of moneyness, the level of trading volume, as indicated by the mean volume statistics, is signiï¬cantly higher for short and medium-dated options than for long-dated options. For example, the average numbers of traded contracts in OTM options for target ï¬rms are 370 and 285 contracts, for maturities of less than 30 and 60 days respectively, while the number is 130 contracts for options with more than 60 days to maturity. This difference is more pronounced for call options than for put options.27 Second, the highest average trading volume tends to be associated with OTM options. • B. Abnormal Trading Volume - Event Study Hypothesis H1 asserts that there is a positive abnormal trading volume in call equity options written on the target prior to a public M&A announcement. We test this formally by running a classical event study. For each of the 1,859 deals in the sample, we obtain the aggregated option volume on the target’s stock, as well as the aggregated volume traded in calls and puts. To compute the abnormal trading volume, we use, as a benchmark, a constant-mean-trading26 Since equity option markets are fairly illiquid, the trading volume data are characterized by numerous zero-volume observations. These data points are omitted from the calculation of the basic summary statistics. 27 Note that, in the entire sample, including both targets and acquirers, the average trading volumes are 1,084 contracts for ATM options, 497 and 398 contracts, respectively, for OTM and ITM options, and 127 and 214 contracts, respectively, for DOTM and DITM options. 15
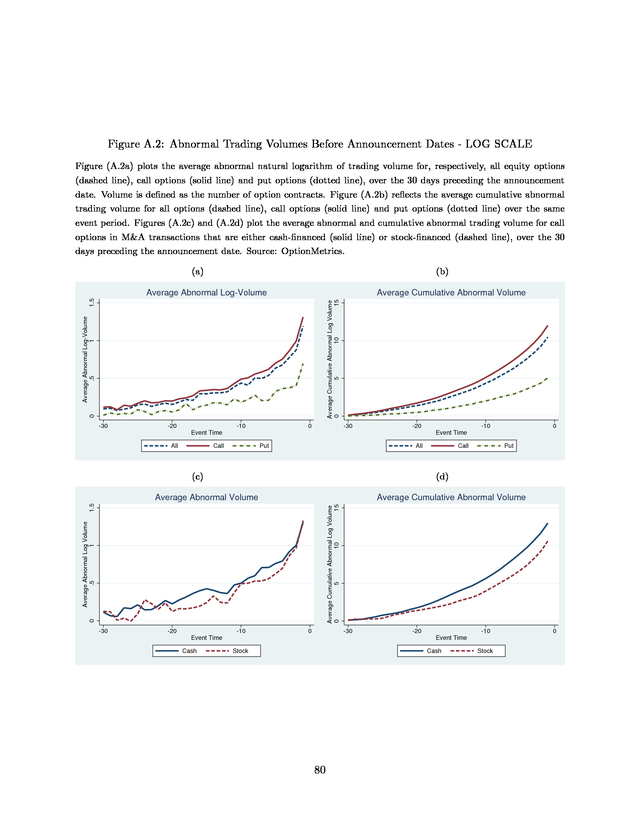
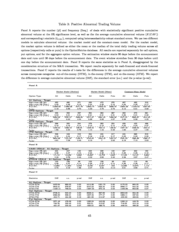
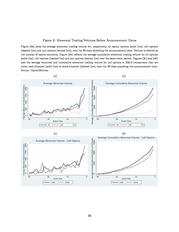
17) volume model, as well as two different volume-based versions of the market models. We deï¬ne the market trading volume as the median (mean) call and put trading volume across all options in the OptionMetrics database. As we are interested in the abnormal trading volume in anticipation of the event, we use, as the estimation window, the period starting 90 days before the announcement date and ï¬nishing 30 days before the announcement date. Our event window stretches from 30 days before to one day before the announcement date. To account for the possibility of clustered event dates, we correct all standard errors for cross-sectional dependence. The results are reported in Table 3. The average cumulative abnormal trading volume for the target ï¬rms is positive and statistically signiï¬cant across all model speciï¬cations.28 The magnitude of the average cumulative abnormal volume over the 30 pre-event days is estimated to be 11,969 contracts for call options, using the median market model. For put options on the target, the average cumulative abnormal volume is also positive and highly statistically signiï¬cant, but over the 30 pre-event days is, at 3,471 contracts, much smaller. The evolution of the average abnormal and cumulative abnormal trading volume for the targets is illustrated in the two panels in Figure 2. It is apparent that the average cumulative abnormal trading volume in put options is quantitatively less important than that in call options, which is primarily driving the results for the overall sample. The daily average abnormal volume for call options is positive and steadily increasing to a level of approximately 1,500 contracts the day before the announcement. Individually, the number of deals with positive abnormal trading volumes at the 5% signiï¬cance level ranges from 472 to 492 for calls, and from 271 to 319 for puts, corresponding to 26% and 15% of the entire sample respectively.29 These results conï¬rm the Hypothesis H1, that there are positive abnormal trading volumes in call and put equity options written on the targets prior to public M&A announcements. In addition to the aggregated results, we stratify our sample by moneyness, and conduct an 28 We report in Table A.2 of the appendix results based on a log transformation of volume Vt , such that the transformed volume tV olt is deï¬ned as tV olt = ln(1 + Vt ). The ï¬ndings are similar. The corresponding graphs are available in Figure A.2. 29 Unreported results indicate that, at the 1% signiï¬cance level, the number of deals with positive abnormal trading volumes in the entire sample ranges from 278 to 292 for calls, and from 138 to 195 for puts, corresponding to frequencies of 16% and 8%, respectively, depending on the market model used as a benchmark. 16
18) event study for each category. We ï¬nd that there is signiï¬cantly higher abnormal trading volume for the targets in OTM call options, compared to ATM and ITM calls, both in terms of volume levels and frequencies. Using the median market model, for instance, Table 3 shows that the average cumulative abnormal volume is 3,797 (1,860) contracts for OTM calls (puts) and 1,702 (1,110) contracts for ITM calls (puts), while it is 1,059 (188) for ATM calls (puts). These values correspond to 383 (300, 448) deals, or 21% (16%, 24%) of the sample for OTM (ATM, ITM) calls, and 387 (254, 316) deals or 21% (14%, 17%), for OTM (ATM, ITM) puts, respectively. In addition, while we ï¬nd that the average cumulative abnormal volume is positive and statistically signiï¬cant for both OTM and ITM calls and puts, it is only statistically signiï¬cant at the 5% level for ATM call options, and not for put options. In Panel B, we differentiate between the results for cash- and stock-ï¬nanced takeovers. The number of deals with statistically signiï¬cant positive abnormal trading volume represents about 26% for both subgroups, which is similar to the results in the overall sample. However, the level of the cumulative abnormal volume is greater for cash than for stock deals, for both call and put options.30 For instance, using the mean market model for the pooled sample, the expected cumulative abnormal volume is 16,567 contracts for cash deals, and 9,530 contracts for stock deals. The differences in the average and cumulative abnormal call option volumes are graphically illustrated in Figures 2c and 2d. Panel C reports the results from paired t-tests for the differences in means of the cumulative average abnormal volumes across different depths. Consistent with our Hypothesis H2, these results emphasize that there is higher abnormal trading volume for OTM call options, compared to ATM and ITM call options. The differences in means, using the median market model, for OTM calls relative to ATM and ITM calls are 2,738 and 2,096 respectively, which are positive and statistically different from zero. On the other hand, the difference in means between ATM and ITM calls is slightly negative (-643), but not statistically different from zero. We do conï¬rm that the average cumulative abnormal volume for ITM put options is higher than for ATM put options. This provides some preliminary evidence that informed 30 While the cumulative abnormal options volume is greater for cash deals than for stock deals, we do not ï¬nd the difference to be statistically signiï¬cant. 17
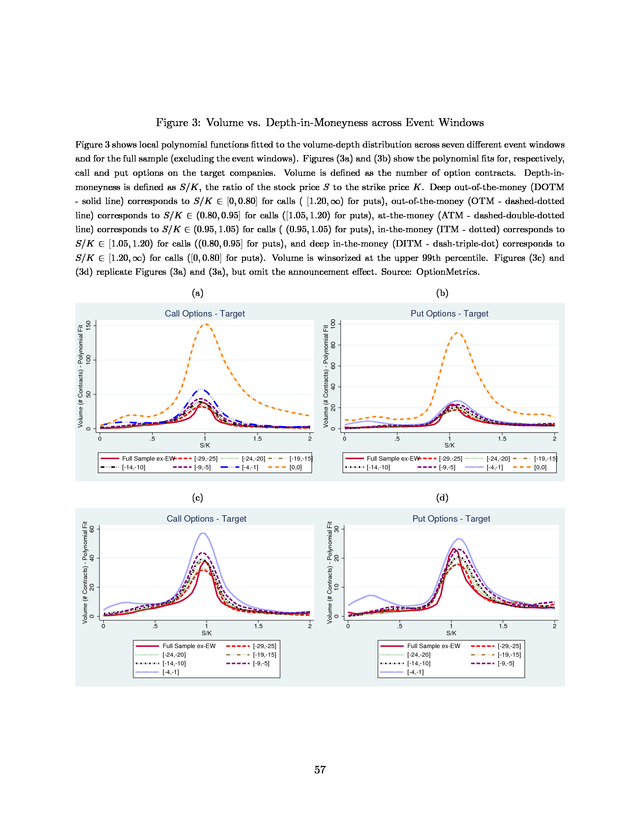
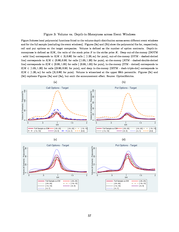
19) traders may not only engage in OTM call transactions but may also sell ITM puts.31 To summarize, the event study further supports Hypotheses H1 and H2. In other words, there is ample evidence of positive abnormal volumes in equity options for the target ï¬rms in M&A transactions, prior to the announcement date. In addition, we document that, for the targets, there is a signiï¬cantly larger amount of abnormal trading volume in OTM call options than in ATM and ITM call options. There is also greater abnormal trading volume in cash- than in stock-ï¬nanced takeovers. However, the evidence that informed traders may also engage in writing ITM put options is not as strong.32 • C. Shifts in the Option Trading Volume Density The previous section illustrated that the 30 days prior to M&A announcement dates exhibit abnormal option volumes for target ï¬rms that are particularly pronounced in OTM call options. The question is whether there is a monotonic and statistically signiï¬cant shift in the entire option trading volume distribution as the announcement date approaches. We formally test for a shift in the bivariate volume-moneyness distribution over time, in anticipation of the announcement dates. Figure 3 visually illustrates the shift in the volume distribution for calls and puts written on the target ï¬rms as we approach the announcement date. Each individual line reflects a local polynomial function ï¬tted to the volume-moneyness pairs. It is striking to see how the volume distribution for call options shifts to the tails and increases the weights of the DITM and DOTM categories as we approach the announcement date. In addition, the volume keeps increasing, in particular in the event window [−4, −1]. The last event window [0, 0] incorporates the announcement effect, whereby the overall average trading level is lifted upwards, and the distribution shifts to ITM call options and OTM puts, as would be expected as the merger has been announced. Another way to visualize the change in the distribution is shown in Figure 4, although this graph is a univariate slice of the underlying bivariate distribution. 31 The expected cumulative abnormal volume for OTM put options is slightly higher than that for ITM put options. The difference of 750 contracts is nevertheless small, given that it is a cumulative measure over 30 days. 32 One reason for this discrepancy may be that writing naked puts is a risky position, especially ITM puts. There is always some probability that the deal will not go through and the stock will tumble. Also, selling naked puts requires a large margin, which may be a binding constraint in the context of limited capital. 18
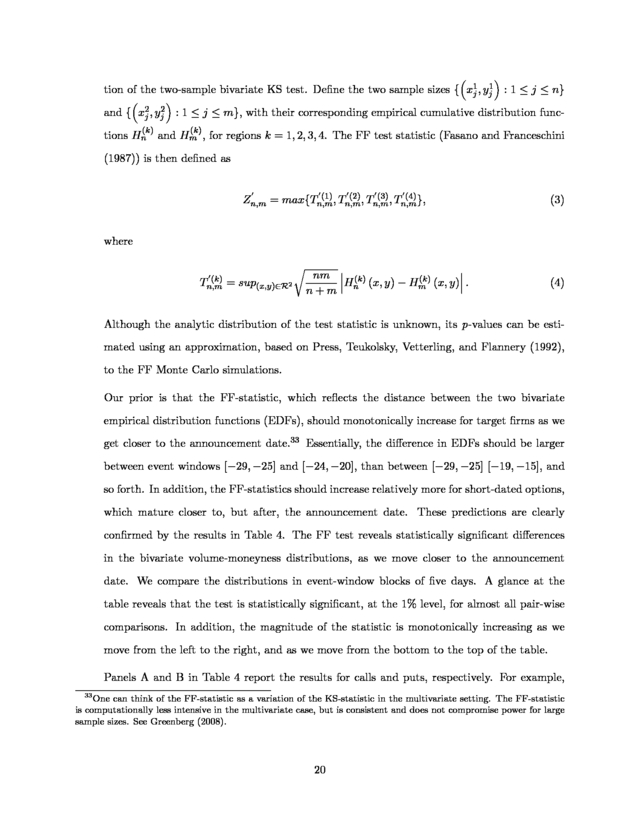
20) The dashed blue line and the solid green line in each plot represent the 90th and 95th percentiles of the distribution, whereas the dotted red lines reflect the interquartile range. It is evident from the ï¬gure that the percentage increase in the percentiles of the volume distribution is very strong. For example, the interquartile range for target call options increases from a level below 50 contracts to approximately 2,000 contracts on the announcement day. To summarize, there is a signiï¬cant shift in both the mean and median trading volume for target ï¬rms in anticipation of M&A transactions. This shift is more pronounced for DOTM and OTM call options, than for ITM and DITM options. This conï¬rms Hypothesis H2 that there is a higher abnormal trading volume in DOTM call options than in ATM and ITM call options. In what follows, we apply a formal statistical test for the shift in the volume distribution. In order to test whether the bivariate volume-moneyness distribution shifts over time prior to announcement dates, we use a two-sample bivariate Kolmogorov-Smirnov (KS) test. The two-sample KS test is a non-parametric test for the equality of two continuous distribution functions. Essentially, the KS-statistic quantiï¬es the distance between the two empirical cumulative distribution functions. While the test statistic is straightforward to compute in the univariate setting with distribution-free properties, the computation in the multivariate setting can become burdensome, particularly when the sample size is large. The reason for this is that, in the univariate setting, the empirical cumulative distribution function diverges only at its observed points, while it diverges at an inï¬nite number of points in the multivariate setting. To see this, remember that, in a multivariate setting, there is more than one deï¬nition of a cumulative distribution function. In particular, in the bivariate setting, the four regions of interest are H (1) (x, y) = P [X ≤ x, Y ≤ y] , H (1) (x, y) = P [X ≥ x, Y ≤ y] , H (1) (x, y) = P [X ≤ x, Y ≥ y] (1) H (1) (x, y) = P [X ≥ x, Y ≥ y] , (2) and we need to evaluate the empirical cumulative distribution function in all possible regions. To reduce computational complexity, we rely on the Fasano and Franceschini (FF) generaliza19
21) 1 tion of the two-sample bivariate KS test. Deï¬ne the two sample sizes { x1 , yj : 1 ≤ j ≤ n} j 2 and { x2 , yj : 1 ≤ j ≤ m}, with their corresponding empirical cumulative distribution funcj (k) (k) tions Hn and Hm , for regions k = 1, 2, 3, 4. The FF test statistic (Fasano and Franceschini (1987)) is then deï¬ned as (1) (2) (3) (4) Zn,m = max{Tn,m , Tn,m , Tn,m , Tn,m }, (3) where (k) Tn,m = sup(x,y)∈R2 nm (k) H (k) (x, y) − Hm (x, y) . n+m n (4) Although the analytic distribution of the test statistic is unknown, its p-values can be estimated using an approximation, based on Press, Teukolsky, Vetterling, and Flannery (1992), to the FF Monte Carlo simulations. Our prior is that the FF-statistic, which reflects the distance between the two bivariate empirical distribution functions (EDFs), should monotonically increase for target ï¬rms as we get closer to the announcement date.33 Essentially, the difference in EDFs should be larger between event windows [−29, −25] and [−24, −20], than between [−29, −25] [−19, −15], and so forth. In addition, the FF-statistics should increase relatively more for short-dated options, which mature closer to, but after, the announcement date. These predictions are clearly conï¬rmed by the results in Table 4. The FF test reveals statistically signiï¬cant differences in the bivariate volume-moneyness distributions, as we move closer to the announcement date. We compare the distributions in event-window blocks of ï¬ve days. A glance at the table reveals that the test is statistically signiï¬cant, at the 1% level, for almost all pair-wise comparisons. In addition, the magnitude of the statistic is monotonically increasing as we move from the left to the right, and as we move from the bottom to the top of the table. Panels A and B in Table 4 report the results for calls and puts, respectively. For example, 33 One can think of the FF-statistic as a variation of the KS-statistic in the multivariate setting. The FF-statistic is computationally less intensive in the multivariate case, but is consistent and does not compromise power for large sample sizes. See Greenberg (2008). 20
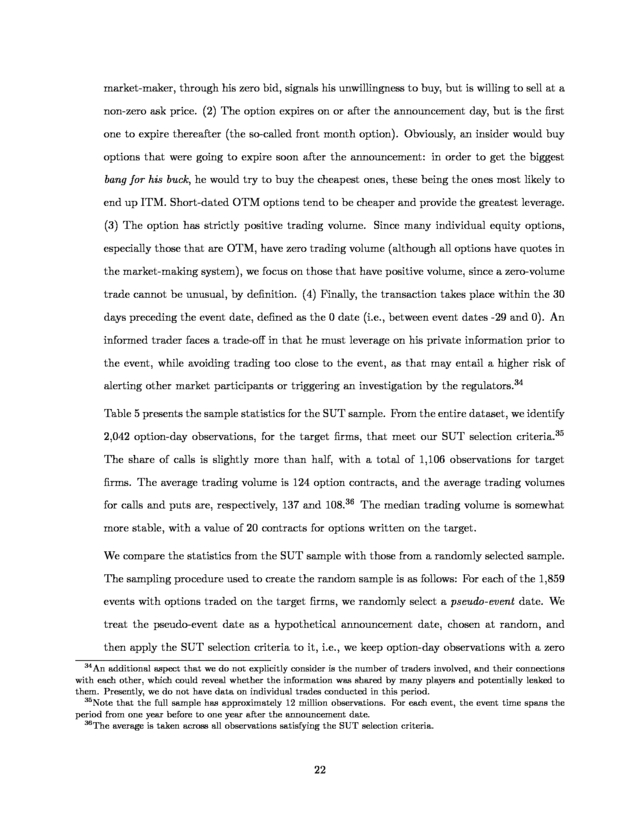
22) the ï¬rst row shows that the bivariate distribution signiï¬cantly shifts from event window [−29, −25] to [−24, −20], with an FF-statistic of 0.0279. The test statistic increases to 0.1592, if we compare event windows [−29, −25] and [−4, −1], and to 0.4070 for event windows [−29, −25] and [0, 0]. For short-dated options with a time to expiration of less than 30 days, the statistic for the difference in distributions for the shift from event window [−29, −25] to [−4, −1], excluding the announcement effect, has a value of 0.3388 (0.34) for call (put) options. This is higher than the announcement effect from event window [−4, −1] to the announcement date. Changes in the bivariate distributions are statistically signiï¬cant at the 1% level for almost all event windows. Overall, as expected, the largest test statistics seem to be associated with comparisons between the announcement date ([0, 0]) and the event window immediately preceding it ([−4, −1]). These formal statistical tests provide evidence that the two-dimensional volume-moneyness distribution shifts signiï¬cantly in both time and depth over the 30 days preceding the announcement day. Hence, the level of the volume distribution increases, with a higher frequency of trades occurring in both OTM calls and ITM puts. These ï¬ndings support the results of the event study and strengthen our conclusions in favor of Hypotheses H1 and H2. In the following subsection, we test whether such a shift in the bivariate distribution is truly random, by comparing the volume distribution of a sample of suspiciously unusual trades to that of a randomly matched sample. • D. Strongly Unusual Trading Volume and Matched Random Sample Our primary goal is to distinguish informed trading from random speculative bets. Hence, we are looking for unusual trading patterns that are clearly different from the patterns exhibited by randomly selected samples, since evidence of non-random trading would point to the existence of informed trading. We analyze extreme cases that are potentially the most likely to reflect informed trading. In this spirit, we deï¬ne as strongly unusual trading (SUT), observations (deï¬ned as the trading volume for an option-day pair, i.e., the end-of-day volume for a given option on the target) meeting the following four criteria for individual options: (1) The daily best recorded bid is zero. This corresponds implicitly to DOTM options where the 21
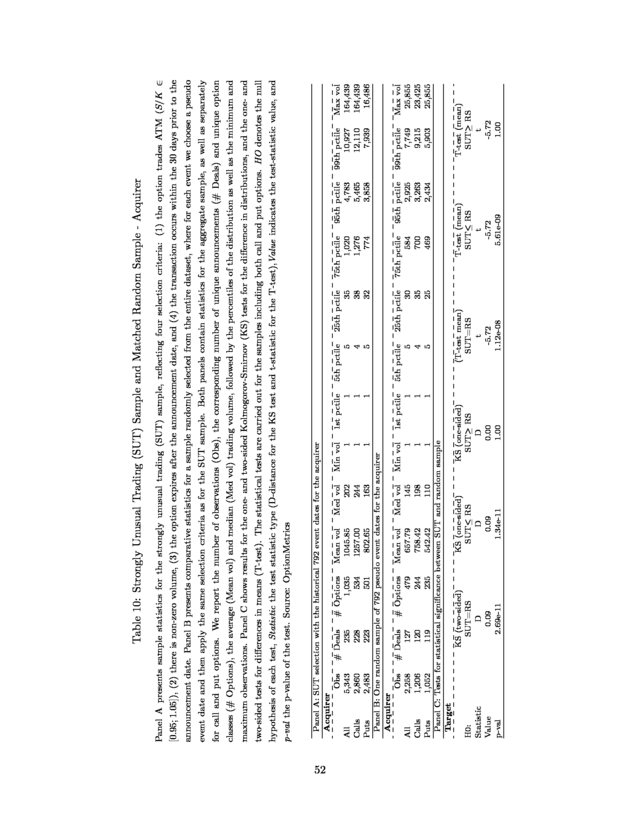
23) market-maker, through his zero bid, signals his unwillingness to buy, but is willing to sell at a non-zero ask price. (2) The option expires on or after the announcement day, but is the ï¬rst one to expire thereafter (the so-called front month option). Obviously, an insider would buy options that were going to expire soon after the announcement: in order to get the biggest bang for his buck, he would try to buy the cheapest ones, these being the ones most likely to end up ITM. Short-dated OTM options tend to be cheaper and provide the greatest leverage. (3) The option has strictly positive trading volume. Since many individual equity options, especially those that are OTM, have zero trading volume (although all options have quotes in the market-making system), we focus on those that have positive volume, since a zero-volume trade cannot be unusual, by deï¬nition. (4) Finally, the transaction takes place within the 30 days preceding the event date, deï¬ned as the 0 date (i.e., between event dates -29 and 0). An informed trader faces a trade-off in that he must leverage on his private information prior to the event, while avoiding trading too close to the event, as that may entail a higher risk of alerting other market participants or triggering an investigation by the regulators.34 Table 5 presents the sample statistics for the SUT sample. From the entire dataset, we identify 2,042 option-day observations, for the target ï¬rms, that meet our SUT selection criteria.35 The share of calls is slightly more than half, with a total of 1,106 observations for target ï¬rms. The average trading volume is 124 option contracts, and the average trading volumes for calls and puts are, respectively, 137 and 108.36 The median trading volume is somewhat more stable, with a value of 20 contracts for options written on the target. We compare the statistics from the SUT sample with those from a randomly selected sample. The sampling procedure used to create the random sample is as follows: For each of the 1,859 events with options traded on the target ï¬rms, we randomly select a pseudo-event date. We treat the pseudo-event date as a hypothetical announcement date, chosen at random, and then apply the SUT selection criteria to it, i.e., we keep option-day observations with a zero 34 An additional aspect that we do not explicitly consider is the number of traders involved, and their connections with each other, which could reveal whether the information was shared by many players and potentially leaked to them. Presently, we do not have data on individual trades conducted in this period. 35 Note that the full sample has approximately 12 million observations. For each event, the event time spans the period from one year before to one year after the announcement date. 36 The average is taken across all observations satisfying the SUT selection criteria. 22
24) bid price, with non-zero trading volume, that are within 30 days of the pseudo-event date, and that have an expiry date after the pseudo-event date. The SUT sample statistics are compared to the random sample trading (RST) statistics in Panel B of Table 5.37 The number of observations, deals and options are somewhat higher in the RST sample than in the SUT sample, by a factor of between 1.4 and 1.8. However, the average and median trading volumes in the SUT sample are more than double those in the RST sample. The maximum observed trading volumes are signiï¬cantly higher in the SUT sample than in the RST sample. However, the distributional statistics illustrate that this effect does not arise because of outliers. In the RST sample, from around the 50th percentile of the distribution upwards, volumes are consistently less than half the trading volumes observed in the SUT sample at comparable cut-offs of the volume distribution. Another interesting feature is that the distance between the median and the mean is roughly constant at around 100 traded contracts in the SUT sample. Statistics for the put options are statistically similar across both samples. For the entire sample, the difference between the average volume (124) before the deal announcement in the SUT sample, and the average volume (57) on a random date in the RST sample, is signiï¬cantly different from zero. The one-sided t-statistic is -6.90, implying a probability of 3 in a trillion that the trading volume observed before the announcement happened by chance. Moreover, the volumes of the SUT sample are overwhelmingly higher for the percentiles over 30%, and about the same for those less than 30%. We point out that the difference between the two samples is likely to be understated in our procedure compared to the procedure of choosing the random sample from the entire sample period. Speciï¬cally, in our case, for each event, we have a maximum of one year of data before and after the event, rather than the whole time-span of traded options from as far back as January 1996 until today. Using the whole time-span the difference would likely be even stronger. Hence, our statistical procedure is biased against failing to reject the null hypotheses stated in the previous section. 37 Since our study is conï¬ned to a limited period, due to the fact that the variance may be large, and to address the possibility that the dates chosen at random may coincide with those of other announcements, we double-checked our results using 100 random samples of 1,859 pseudo-events for the target ï¬rms, in order to minimize the standard error of our estimates. As expected, the results from this robustness check were very similar to the original results. 23
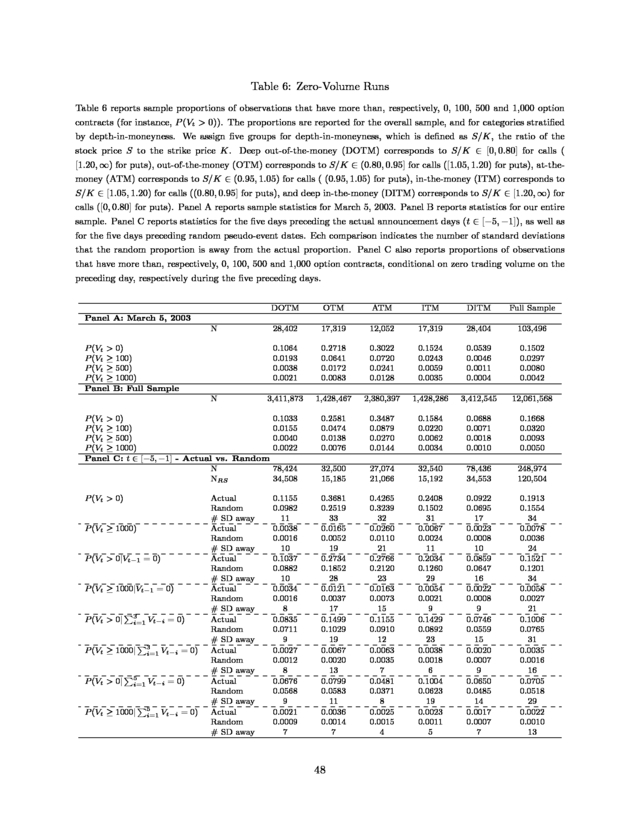
25) To summarize, the entire distribution of trading volumes differs signiï¬cantly between the SUT and RST samples for the target ï¬rms. In particular, we observe that an average trading volume above 100 contracts, with a mean-to-median distance of 100 contracts, can be considered strongly unusual and non-random when the transactions occur at a “zero-bid” within 30 days of the announcement date on options expiring after the announcement. This test provides additional evidence in favor of Hypothesis H1, showing that there is a non-random increase in the trading volume on target ï¬rms prior to public M&A announcements, particularly if we restrict ourselves to the most illiquid and leveraged options in the SUT sample. • E. Zero-Volume Runs As emphasized earlier, liquidity is low in equity options. Given the signiï¬cant number of zero-volume observations that characterize the data for equity options, we compare the proportions of non-zero trading volume between the pre-announcement period and any randomly chosen period to supplement our forensic analysis of the behavior of option volume. We also investigate proportions of non-zero trading volume conditional on there being no trading volume for the preceding one to ï¬ve days. Each observation corresponds to an option series characterized by its issuer, the type (put-call), strike and maturity. First, Panel A in Table 6 reports the volume proportions for a randomly chosen date, which turns out to be March 5, 2003. On that day, OptionMetrics contains a total of 103,496 observations, of which 28,402 are classiï¬ed as DOTM and 28,404 are classiï¬ed as DITM according to our deï¬nition of depth as the ratio of the stock price to the strike price. As expected, trading volume is generally low. Only 15% of all options were traded, about 3% were traded with more than 100 contracts, and only 0.42% were traded with more than 1,000 option contracts. The stratiï¬ed proportions reveal that the proportion of observations with non-zero trading volume is largest in the ATM category, followed by the OTM. We compare these proportions ï¬rst to those from our overall sample, in Panel B. The proportions are very similar to those observed on March 5, 2003. This is conï¬rmatory evidence that our sample is representative of a typical trading day. Panel C documents similar proportions for the ï¬ve days preceding the announcement day. 24
26) These proportions are compared to a randomly chosen sample in Panel C, where for each M&A transaction, we simulate a random pseudo-event date and look at the proportions of non-zero-volume observations in the ï¬ve days leading up to the pseudo-event. Rather than reporting standard errors, we indicate how many standard deviations the proportion in the random sample lies from that actually observed.38 The lowest difference between the proportion in the actual and random sample is four standard deviations. This value is obtained for the proportion of volumes above 1,000 contracts, for ATM options, conditional on no trading volume during the ï¬ve preceding days. For all other comparisons, the difference corresponds to at least ï¬ve standard deviations. A value of ï¬ve standard deviations corresponds approximately to a chance of 1 in a million that the randomly observed proportion would be larger than on the pre-announcement event date. As any other comparison leads to even larger differences, we believe the odds of one in a million to be a conservative estimate. • F. Characteristics of Abnormal Volume We have documented that abnormal trading volume in equity options ahead of M&A announcements is pervasive, non-random and most concentrated in OTM call options. This leaves open the question of whether certain target companies are more likely than others to exhibit unusual trading volume. In order to answer this question, we regress the cumulative abnormal option trading volume in call and put options over the 30 pre-announcement days on a set of categorical variables reflecting M&A deal characteristics and several market activity variables. We test the following benchmark speciï¬cation: CABV OL = β0 + β1 SIZE + β2 CASH + β3 T OE + β4 P RIV AT E + β5 COLLAR (5) + β6 T ERM + β7 F RIEN DLY + β8 U S + γt + ε, where CABV OL denotes the cumulative abnormal trading volume in call or put options respectively, scaled by the average normal volume over the 30 pre-announcement days.39 All 38 Note that each option volume observation follows a Bernoulli variable taking the value 1 if volume is positive (respectively larger than 100, 500 or 1,000 contracts) and 0 otherwise. Assuming independence, the sum of all observations follows a binomial distribution. The standard error of proportion p obtained from a random sample is p(1−p) given by , where N is the number of observations. N 39 We note that this analysis is based on a log transformation of volume. Hence, the scaled cumulative abnormal 25
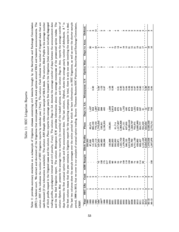
27) speciï¬cations contain year ï¬xed effects γt , and standard errors are either robust or clustered by announcement day. First, we investigate several M&A deal characteristics that may imply a higher likelihood of informed trading. Our strongest prior is that cumulative abnormal volume should be higher for cash-ï¬nanced deals, given that cash-ï¬nanced deals are known to have higher abnormal announcement returns (as documented by Andrade, Mitchell, and Stafford (2001)). Thus, we expect that an informed trader will beneï¬t more from trading in such deals if he anticipates a higher abnormal return. We test for this by including a dummy variable CASH. In addition, “smart” insiders may prefer trading in larger companies, whose stocks (and therefore their options) tend to be more liquid, and hence, less likely to reveal unusual, informed trading. Thus, we expect cumulative abnormal volume to be higher for larger deals, measured by SIZE, a dummy variable that takes the value one if the deal is above the median transaction value, and zero otherwise. We also suspect that a bidder that has a toehold in the company (T OE) is more likely to gather information about a future takeover, and is hence more likely to trade based on his private information. Alternatively, an investor with a toehold may refrain from trading as he would be the ï¬rst suspect in any investigation. We also control for other deal characteristics, such as whether the target is taken private post-takeover (P RIV AT E), whether the deal has a collar structure (COLLAR), whether it involves a termination fee upon a failure of the deal negotiations (T ERM ), whether the deal attitude is considered to be friendly (F RIEN DLY ), and whether the bidder is a US-headquartered company (U S). The results for the benchmark regressions of cumulative abnormal volume in the target call options are reported in columns (1) and (2) of Table 7. The two single most important predictors are cash-ï¬nanced deals and the size of the target company. This evidence is consistent with our prior assumption that informed trading in target call options would be signiï¬cantly higher for cash deals, which are anticipated to have higher abnormal announcement returns, and for more liquid companies, for which it is easier to hide informed trading. Quantitatively, a target deal above the median transaction value has, on average, 3.32 % greater cumulative abnormal call trading volume relative to its normal volume than a target below the median volume is comparable across companies and interpretable as a percentage relative to normal volume. 26
28) deal size. Similarly, cash-ï¬nanced deals have, on average, 6.37 % greater cumulative abnormal volume than non-cash-ï¬nanced deals. Given that the average cumulative abnormal volume is approximately 12,000 contracts, the typical cash-ï¬nanced deal has about 764 more contracts traded during the 30 days before an announcement. The cash indicator is consistently robust across all speciï¬cations, with similar economic magnitudes. If the bidder already has a toehold in the company, cumulative abnormal volume is about 5.6 % smaller. The negative coefficient favors our second conjecture that those connected with equity stake holders with a prior interest may make more of an attempt to keep their intentions secret, given that they would be the ï¬rst suspects in the case of insider trading. Nevertheless, we point out that the coefficient on T OE loses its signiï¬cance in other speciï¬cations with additional control variables. Deals that embed a collar structure and a termination fee in their negotiations are also more likely to exhibit higher cumulative abnormal volume, by about 7.23 and 5.65 %, on average. A collar structure implicitly deï¬nes a target price range for the takeover agreement. Moreover, a termination fee makes it more likely that a negotiation will be concluded. Thus, both variables are associated with greater certainty about the magnitude of the target’s stock price increase, conditional on announcement. This is consistent with a greater likelihood of informed trading in the presence of greater price certainty. All other variables are statistically insigniï¬cant. The adjusted R2 of the regression 6%, reasonable given the likely idiosyncratic nature of the derived statistic, CABV OL, denoting the cumulative abnormal trading volume. In line with Acharya and Johnson (2010), who argue that the presence of more syndicate loan participants leads to more insider trading in leveraged buyouts (LBOs), we conjecture that the more advisors are involved in the deal negotiations, the higher is the probability of information leaking to the markets. The number of target and acquirer advisors is measured by ADV ISORS. Columns (3) and (4) report a positive coefficient, which is, however, not statistically signiï¬cant. In columns (5) and (6), we proxy for the size of the company using a dummy variable SALES, which takes the value one if the target has more sales than the median. We also include the 27
29) takeover price (P RICE), and control for the offer premium. Cumulative abnormal volume is positively associated with companies that have higher sales. Companies with above-median sales have, on average, a 3.32 % greater cumulative abnormal call volume. We have omitted the size dummy here because of potential multicollinearity issues. The coefficient of the offer premium is negative, which could be associated with the fact that, percentage-wise, it is easier to offer greater markups for low-market-capitalization ï¬rms. Also, the offer price is negatively associated with a higher cumulative abnormal volume, although the effect is statistically indistinguishable from zero. We verify whether various market activity variables have an impact on the pre-announcement cumulative abnormal call volume. We include T RU N U P , the pre-announcement cumulative abnormal stock return for the target, T AN N RET , the target’s announcement abnormal return, T T P RET 1, the target’s post-announcement cumulative abnormal return, and ARU N U P , the abnormal stock return for the acquirer before the announcement day. M KT V OL denotes the market volume on the day before the announcement day. These results are reported in columns (7) to (10). The pre-announcement run-up in the target’s stock price is strongly positively related to the cumulative abnormal volume. On the other hand, the target’s cumulative abnormal announcement return is negatively associated with the cumulative abnormal trading volume for call options. All other variables are statistically insigniï¬cant. The coefficients remain very robust for large deals that are cash-ï¬nanced, that have a collar structure, and that have a termination fee. In this ï¬nal regression speciï¬cation, the explanatory power increases to 14 %. We have repeated the analysis for cumulative abnormal volume in put options. While the results are qualitatively similar, the magnitudes of the coefficients are typically smaller. The table showing the results for put options is provided in the Internet appendix, Table A.3. To summarize, we ï¬nd that the cumulative abnormal options trading volume in call options is signiï¬cantly higher for larger M&A deals that are cash-ï¬nanced, have a collar structure, or include a termination fee. We ï¬nd a similar, but weaker, relationship for the cumulative abnormal volume of put options. Overall, our interpretation of the evidence is that informed traders are more likely to trade on their private information when the anticipated abnormal 28
30) stock price performance upon announcement is larger and when they have the opportunity to hide their trades due to greater liquidly of the target companies. Overall, our forensic analysis of the trading volume observed for equity options prior to M&A announcements conï¬rms our prior assumptions stated in Hypotheses H1 and H2. The next step is to investigate Hypotheses H3 to H6 by focusing on the information embedded in equity option prices, based on their implied volatilities and their liquidity. 5.1.2 Implied Volatility Implied volatility is the summary statistic of the price behavior of options. Using this metric of option prices, we conduct a forensic analysis over the 30 days preceding the M&A announcement date. As a complement to the volume results, we ï¬rst conduct an event study to test for the presence of positive excess implied volatility relative to a market benchmark. Second, we study the behavior of the convexity of the option smile, the relationship between the implied volatility and the strike price, in anticipation of news releases. Third, we investigate the bid-ask spread, as a measure of illiquidity, around the announcement date. Finally, we address the hypothesis related to the term structure of implied volatility, the relationship between implied volatility and the time to expiration of the option. • A. Excess Implied Volatility - Event Study We use the interpolated volatility surface in the OptionMetrics database, a three-dimensional function of the implied volatility in relation to the strike price and the time to expiration, for this exercise. To analyze the behavior of ATM implied volatility, we use the 50 delta (or a 0.50 hedge ratio) options in absolute value (for both calls and puts), and we reference the 80 and 20 delta (or 0.80 and 0.20 hedge ratios) options in absolute value for the ITM and OTM options respectively. We test two different model speciï¬cations for our results: a simple constant mean volatility model and a market model, in which we use the S&P 500 VIX index as the market’s benchmark for implied volatility. The estimation window runs from 90 to 31 days before the announcement date, while our event window relates to the 30 days before the event, excluding the announcement day itself. All standard errors are clustered by time to 29
31) account for the bunching of events on a given day. Panel A in Table 8 documents that excess implied volatility is quite pervasive in our sample. At the 5% signiï¬cance level, using the market model, there are about 812 cases (44% of the 1,859 deals) with positive excess implied volatility for ATM call options, and about 798 cases (43% of the 1,859 deals) with positive excess implied volatility for ATM put options. The frequencies are similar for OTM implied volatilities, and slightly lower for ITM implied volatilities, where positive excess implied volatility is documented for 39% (calls) and 41% (puts) of all cases. To summarize, the event study conï¬rms our Hypothesis H3, which states that there should, on average, be positive cumulative excess implied volatility for the target companies. These results are graphically presented in Figure 5 for ATM implied volatilities. For targets, the daily average excess ATM implied volatility starts increasing about 18 days before the announcement date and rises to an excess of 5% the day before the announcement. • B. Information Dispersion and Bid-Ask Spreads To address Hypothesis H4, we study the evolution of the bid-ask spread in anticipation of the M&A announcement. The prediction of the Hypothesis H4 is that the percentage bid-ask spread in option premia should widen prior to the announcement. Strong evidence in favor of this hypothesis would indicate that the market (i.e., the market-maker) is reacting to a substantial increase in the demand for options, in particular OTM calls. Figure 6a plots the evolution of the average percentage bid-ask spread from 90 days before the announcement date to 90 days after the event. The ï¬gure shows that the average percentage bid-ask spread on target options rises from about 35% to 55%, and then jumps up to approximately 80% following the announcement. Interestingly, this rise in bid-ask spreads is restricted to DOTM and OTM options, as is illustrated in Figure 6c. Similarly in our earlier exercise, we verify whether we are able to observe such a pattern on a random day. Thus, for each M&A transaction, we draw a random pseudo-event date and construct the average bid-ask spread in pseudo-event time. The outcome is illustrated by the flat line visualized in Figure 6b. Clearly, the average percentage bid-ask calculated in event 30
32) time for randomly chosen announcement dates exhibits no pattern of rising bid-ask spreads in response to the arrival of any asymmetric information from potential insiders. • C. The Volatility Smile and the Term Structure of Implied Volatility Hypothesis H5 predicts that the convexity of the option smile, for target ï¬rms, should increase for call options and decrease for put options, prior to M&A announcements.40 We investigate this question by plotting in Figure 7 various measures relating to the convexity of the option smile. Figures 7a and 7b illustrate several documented measures of the implied volatility skewness. The ï¬rst measure in Figure 7a is computed separately for calls and for puts. For call options, it is the difference between the OTM implied volatility with a delta of 20 and the ATM implied volatility with a delta of 50 (left axis). For put options, it is deï¬ned as the difference between the ITM implied volatility for puts with a delta of -80 and the ATM implied volatility for puts with a delta of -50 (right axis). In Figure 7b, two measures of skewness are plotted. The ï¬rst measure of implied volatility skewness on the left axis of the ï¬gure is measured as the difference between the OTM call and put implied volatilities, divided by the ATM implied volatility. The second measure, on the right axis, is measured as the difference between the OTM put implied volatility and the ATM call implied volatility. To our surprise, both measures seem to remain flat prior to the announcement date. We cannot reject the hypothesis that, prior to the announcement, there is no change in the “skew” of the options on the target ï¬rms. Hypothesis H6 states that the term structure of implied volatility for options on the target ï¬rms should decrease before takeover announcements. The justiï¬cation for this hypothesis is that informed traders obtain the highest leverage by investing in short-dated OTM call options that expire soon after the announcement, so as to maximize the “bang for their buck. Hence, demand pressure for short-dated options should lead to a relative price increase in options with a short time to expiration compared to long-dated options. Thus, a conï¬rmation of our hypothesis would be supportive of the fact that, on average, activity in the options market before major takeover announcements is partially influenced by informed traders. Figure 7c 40 In the case that the IV/strike price curve exhibits a “skew”, the change in convexity should “flatten” the curve. 31
33) documents that the slope of the average term structure of implied volatility, calculated as the difference between the implied volatilities of the 3-month and 1-month options, decreases from -1.8% by about 2.5 percentage points to approximately -4.3% over the 30 days before the announcement date. This result is obtained for both call and put options. However, the term structure of implied volatility remains at approximately the same level, essentially unchanged, if we randomize the announcement dates as a control sample. In a nutshell, we ï¬nd evidence in support of the fact that the average implied volatility spread between OTM and ATM call options increases signiï¬cantly for target ï¬rms prior to M&A announcements. In addition, the term structure of implied volatility becomes more negative for targets, and remains roughly flat for acquirers, as we approach the announcement date. 5.2 Acquirer Firms We have documented strongly unsual trading activity in options written on target companies. Given this evidence, we also suspect that we will observe unusual trading activity for the acquiring ï¬rms. Chan, Ge, and Lin (2014), for instance, document the predictive ability of the option volume for the ex-post announcement returns of the acquirer. However, the question of how an insider would trade in equity options on the acquirer, and what strategy he would use, is somewhat more subtle. The consistent empirical evidence of positive cumulative abnormal returns for the targets implies that in this case the insider beneï¬ts most from directional strategies. In contrast, given the uncertainty of the stock price evolution of the acquirer around the announcement date, an insider trading in acquirer options would beneï¬t most by engaging in strategies that would beneï¬t from higher volatility (i.e., a jump in stock prices, in either direction). More speciï¬cally, the optimal strategy would be a zero-delta, long-gamma trade, as stated in Hypothesis H7. As stated earlier, this should be particularly true for cash deals, and, in some cases, also true for stock exchange and hybrid deals. In our sample, this will mean that, in a majority of deals, there will be uncertainty regarding the acquirer’s stock price. We, therefore, concentrate on such “volatility” strategies. We ï¬rst provide a quick overview of the summary statistics on the option trading volume, stratiï¬ed by time to expiration and moneyness, in Table 9. Panels A to C report statistics for all options in the sample, while Panels D to F, and G to I, report the numbers separately for calls and 32
34) puts. Similarly to the properties for the target ï¬rms, the mean trading volume is higher for shortand medium-dated options compared to long-dated options.41 On the other hand, the average trading volume is higher for options on acquirer ï¬rms (547 contracts) than for those on targets (283 contracts). Importantly, the distribution of volume as a function of moneyness exhibits a hump-shaped pattern for acquirers, irrespective of whether the options are short- or long-dated. Hence, trading volume tends to be highest for ATM options and decreases as the moneyness, S/K, moves further ITM or OTM. In the entire universe, for instance, the average volume is 1,084 contracts ATM, 497 and 398 contracts respectively, for OTM and ITM options, and 127 and 214 contracts respectively, for DOTM and DITM options. This contrasts with the distribution for the targets, where the highest average trading volume tends to be associated with OTM options. According to Hypothesis H7, we anticipate an increase in the trading volume of option pairs that have high gammas (convexity), such as ATM straddle strategies, for example. In order to test this hypothesis, we match, on each day, all call-put pairs (CP pairs) that are written on the acquirer’s stock, and that have identical strike prices and times to expiration. OptionMetrics only provides information on the total trading volume associated with a speciï¬c option, and there is no disclosure on the total number of trades. Thus, the lower of the call and put trading volumes in a CP pair represents an upper bound on the total volume of straddle trading strategies implemented in a given day. Even though this number does not accurately capture the exact straddle volume, a change in its upper bound across event times could be informative about the potential trading strategies undertaken by insiders, as a proxy. Figure 8 illustrates how the upper bound on the volume of straddle trading strategies changes from 30 days before to 20 days after the ï¬rst takeover attempt has been publicly announced. In addition, we report the average and total number of CP pairs identifed on each event day. According to our hypothesis, the straddle trading volume should increase for acquirer ï¬rms prior to the announcement. The upward trend is visually conï¬rmed in the graphical illustrations. We have documented that there is, on average, a greater trading volume in ATM options for acquiring companies, and that, prior to announcements, the trading volumes of strike-matched CP 41 For example, the average numbers of traded contracts in OTM options, for acquirers, are 497 and 384 contracts for maturities of less than 30 and less than 60 days respectively, while the number is 193 contracts for options with more than 60 days to maturity. This difference is more pronounced for call options than for put options. 33
35) pairs increase. We therefore, evaluate whether any increase in the ATM trading volume in the pre-event window is random. For this purpose, we present a modiï¬ed strongly unusual trading sample for the acquirer (SUT-A). We select all options that (1) are ATM, (2) expire on or after the announcement day (the so-called front month option), (3) have strictly positive trading volume, and (4) are traded within 30 days of the event date. Table 10 presents the sample statistics for the SUT-A sample. From the entire dataset, we identify 5,343 option-day observations for the acquirer ï¬rms that meet our SUT-A selection criteria. The share of calls is slightly more than half, with a total of 2,860 observations. The average trading volume is 1,046 option contracts, and the average trading volumes for calls and puts are, respectively, 1,257 and 803. The median trading volume for all options is 202, and the median for calls (puts) is 244 (163). We compare the statistics from the SUT-A sample with those from a randomly selected sample. For each deal, we randomly select a pseudo-event date and apply the SUT-A selection criteria. Panel B illustrates that, in the random sample, there are fewer ATM trades (about half as many as in the SUT-A sample). For the entire sample, the difference between the average volume (1,046) before the deal announcement in the SUT-A sample and the average volume (658) on a random date in the RST sample is signiï¬cantly different from zero. The one-sided t-statistic is -5.72, implying a probability of 6 in a billion that the trading volume observed before the announcement happened by chance. To summarize, our evidence suggests that there is a non-random increase in the ATM trading volume on the aquirer’s options ahead of an M&A announcement. We also document an increase in the number of ATM strike-matched CP pairs, suggesting that there is an increase in long-gamma strategies. This evidence is consistent with Hypothesis H7. 6 SEC Litigation Reports Up to this stage, we have only presented statistical evidence of unusual option trading activity ahead of M&A announcements. We now verify whether there is any relationship between the unusual activity and insider trading cases that we know, with hindsight, to have been prosecuted. 34
36) To do so, we scan the 8,000 actual litigation releases concerning civil lawsuits brought by the SEC in federal court.42 We extract all cases that encompass trading in stock options around M&A and takeover announcements and report the characteristics of all litigated cases in Table 11.43 We ï¬nd that the characteristics closely reflect the highlighted statistical anomalies of unusual option volumes and prices, that we ï¬nd to be very pervasive prior to M&A announcements. 6.1 The Characteristics of Insider Trading In total, we ï¬nd 102 unique cases involving insider trading in options ahead of M&As from January 1990 to December 2013, with an average of about four cases per year. Interestingly, the litigation ï¬les contain only one instance of insider trading involving options written on the acquirer.44 About one third of these cases (33 deals) cite insider trading in options only, while the remaining 69 cases involve illicit trading in both options and stocks. In addition, we ï¬nd 207 M&A transactions investigated in civil litigations because of insider trading in stocks only. The large number of investigations for stock trades relative to option trades stands in contrast to our ï¬nding of pervasive abnormal call option trading volumes that are relatively greater than the abnormal stock volumes.45 Out of these 102 SEC cases, 88 correspond to our sample period, which stretches from January 1, 1996 to December 31, 2012. The average yearly number of announcements in our sample is 109.46 According to these statistics, and assuming that the publicly disclosed deals represent all litigated cases, we conclude that the SEC litigated about 4.7% of the 1,859 M&A deals included in our sample. Several of the litigated cases do not appear in our sample, one reason being the aforementioned criteria for inclusion in our sample. On the other hand, some prominent cases of insider trading, such as JPM Chase-Bank One, do not appear in the SEC database. We have three potential explanations for these discrepancies. First, the SEC only reports civil litigations. If a case is deemed criminal, then the Justice Department will handle it and it will not appear in the SEC records. Second, the SEC may refrain from divulging the details of a case to protect the identity 42 The litigation reports are publicly available on the SEC’s website, https://www.sec.gov/litigation/litreleases.shtml. Table A.4 in the Internet appendix contains detailed information on each individual case. 44 This case is the 1997 acquisition of Barnett Banks by the Nations Bank Corporation. 45 We emphasize the takeover of Nexen by CNOOC, which was involved in a SEC lawsuit because of insider trading in stocks, while the newspapers broadly discussed unusual option trades. 46 Note that, while we also include incomplete and rumored deals, we only include transactions that imply a change in corporate control, and we exclude small deals with market values below 1 million USD. 43 35
37) of a whistleblower. In these instances, if the case is settled out of court, it will not appear in the public record. Third, the SEC will not even bother to litigate if there is little chance of indictment, which will depend on the availability of clear evidence of insider activity. Overall, in spite of these biases, 66 of the SEC litigation cases are covered by our study. In other words, our sample covers 65% of all litigated cases related to insider trading in equity options around M&A events, with the Type II error rate being 35%.47 We next describe the characteristics of the option trades that we are able to extract from the information in the SEC litigation reports.48 About 59 % of all cases are cash-ï¬nanced transactions. We would expect investors with private information to be less likely to trade on stock-ï¬nanced announcements, as the announcement return is typically higher for cash deals. This is consistent with our ï¬nding of a greater cumulative abnormal call option volume for such transactions. The average proï¬t reaped through “rogue trades” in our sample period is 1.568 million USD. As we conjectured earlier, this proï¬t arises from deals that are almost exclusively purchases of OTM call options, at a single strike price or multiple strike prices. The litigation reports reference put trades in only 3 % of all cases. Also, as expected, the average ratio of stock price to strike price is 94%. Furthermore, the insider trades are primarily executed in the so-called front month options, with an average option time to expiration of one month. We note that there is large variation in the timing of trades. However, the majority of trades occur within 21 days of the announcement. The average inside trader transacts 16 days before the announcement date. It takes the SEC, on average, 756 days to publicly announce its ï¬rst litigation action in a given case. Thus, assuming that the litigation releases coincide approximately with the actual initiations of investigations, it takes the SEC a bit more than two years, on average, to prosecute a rogue trade. The ï¬nes, including disgorged trading proï¬ts, prejudgment interest and civil penalty, if any, appear large enough to adequately recuperate illicit trading proï¬ts. The average ï¬ne is, at 3.54 million USD, a bit more than double the average rogue proï¬t. This is, however, largely driven by the ï¬gures in 2007, when 47 To be precise about the deï¬nitions of Type I and Type II errors, we start with the null hypothesis that our sample covers all the cases litigated by the SEC. Thus, we deï¬ne the Type I error to include cases that we identify as having originated from an insider, but were not litigated by the SEC. Similarly, we deï¬ne the Type II error to include cases litigated by the SEC that we fail to identify. By deï¬nition, these cases are not in our sample. 48 Admittedly, the SEC has access to much more granular and detailed information on these cases, but we are not aware of any study that systematically analyzes this information, other than the early study by Meulbroek (1992) that focuses on stock trading and for a much smaller number of cases than the present study includes. 36
38) the ratio of the average ï¬ne relative to the average proï¬t was about 5.6. Finally, the typical insider trade involves more than one person. The average number of defendants is three. To summarize, the bulk of the prosecuted trades are purchases of plain-vanilla short-dated OTM call options that are approximately 6 % OTM, occur within the 21 days prior to the announcement, and more frequently relate to cash-ï¬nanced deals. These characteristics closely resemble the anomalous statistical evidence we ï¬nd to be so pervasive in a representative sample of M&A transactions: pervasive unusual and abnormal option trading volumes in particular for OTM and short-dated call options. 6.2 The Determinants of Insider Trading Litigation In this subsection, we examine the determinants of insider trading litigations. We emphasize that we are unable to answer the question of whether certain characteristics reflect deals that are more prone to insider trading, or whether insider trading is more easily detected by the SEC because of certain company or market attributes. For example, the SEC may be more attentive during speciï¬c market conditions and to a certain type of company.49 Nevertheless, we believe that this descriptive evidence is informative about the nature of insider trading litigations. To understand the characteristics of deals investigated by the SEC, we estimate a logit model for all M&A deals, classiï¬ed as either litigated by the SEC or not. The identifying indicator variable SEC takes the value one if the deal has been litigated, and zero otherwise. We control for four different categories of explanatory variables in our estimation: (i) deal characteristics, (ii) deal ï¬nancials, (iii) stock price information, and (iv) option volume and price information. For the variables relating to deal characteristics, we estimate the following logit model: P r (SEC = 1) = F (β0 + β1 SIZE + β2 CASH + β3 CHALLEN GE + β4 COM P LET E (6) +β3 T OE + β4 P RIV AT E + β5 COLLAR + β6 T ERM + β7 F RIEN DLY + β8 U S + γt ) , where F (·) deï¬nes the cumulative distribution of the logistic function, and all explanatory vari49 We suspect that the second assumption may be true. Given our discussions with a senior former official at the regulator, the SEC operates under severely constrained resources. It is, therefore, more likely to litigate cases that are more likely to result in a conviction and that have generated substantial illicit trading proï¬ts. In addition, the recent emphasis on the issue with the creation of a Whistleblower Office suggests that there is time variation, in particular a recent increase, in the intensity of litigation. 37
39) ables are categorical variables that take the value one if a condition is met and zero otherwise. SIZE takes the value one if the transaction is larger than the median M&A deal value. CASH characterizes cash-ï¬nanced takeovers. CHALLEN GE identiï¬es deals that have been challenged by a second bidder. COM P LET E identiï¬es completed deals that are not withdrawn or failed. T OE indicates whether a bidder already had a toehold in the target company. P RIV AT E equals one if the acquirer privatized the target post-acquisition, COLLAR identiï¬es transactions with a collar structure, T ERM is one for deals that have a termination fee that applies if the takeover negotiations fail. F RIEN DLY refers to the deal attitude. U S is one if the bidder is a US-based company. All speciï¬cations contain year ï¬xed effects. We report the logit coefficients (and odds ratios in parentheses), using Firth’s method for bias reduction in logistic regressions, in Table 12. The evidence in column (1) suggests that the likelihood of SEC litigation is higher for larger and completed deals that are initiated by foreign bidders. Speciï¬cally, a transaction greater than the median M&A deal value is 2.35 times more likely to be pursued. The log-odds ratio suggests that an acquisition undertaken by a foreign bidder is roughly twice as likely to be prosecuted as an M&A transaction initiated by a US-based bidder. Completed deals are strong predictors of options litigation, as a withdrawn or rumored deal is about 22 times less likely to be investigated. The pseudo-R2 of the regression is reasonable, with a value of 16%. We also investigate whether the total number of target and acquirer advisors matters in the prediction of litigation. Given that a greater number of parties involved in the transaction may increase the likelihood of leakage, one could expect to observe a positive effect. Column (2) suggests that there is a positive relationship between the number of advisors and the probability of litigation, but the effect is not statistically signiï¬cant. We further test the importance for the probability of litigation of the offer premium (P REM 1D), the offer price (P RICE), and another proxy for the size of the target - net sales (SALES). Column (3) indicates that both the offer premium and the offer price are positively related to the probability of SEC litigation, although the magnitudes of the odds ratios are just above one. In addition to the deal characteristics and deal ï¬nancials, we test whether we can predict the SEC litigations based on the stock price behavior of the parties involved in the transaction. Thus, in column (6), we estimate an augmented logit model and include T RU N U P , the target’s 38
40) pre-announcement cumulative abnormal stock return, T AN N RET , the target’s announcement abnormal return, T T P RET 1, the target’s post-announcement cumulative abnormal return, and ARU N U P , the acquirer’s abnormal stock return before the announcement day. Of these variables, only the target’s post-announcement cumulative abnormal return is highly statistically signiï¬cant. The coefficient of 2.44 suggests that a target with a 1% higher cumulative abnormal postannouncement return is approximately 11 times more likely to be investigated. This corresponds to a marginal effect of 8 %, keeping all other variables at their median levels. To complete our analysis, we also check whether the market environment in the period leading up to the announcement has predictive ability for the SEC litigations. Thus, we further augment the base model with M KT V OL, the market volume on the day before the announcement, and ABN ORM V OLC, the target’s total abnormal call trading volume during the 30 pre-announcement days.50 None of these variables exhibits statistical signiï¬cance in explaining the SEC civil litigations. Throughout all speciï¬cations, we note that the coefficients on SIZE, COM P LET E, and U S remain statistically signiï¬cant, with similar economic magnitudes. In columns (6) to (10), we test whether there is any fundamental difference between those SEC cases that were pursued because of insider trading in options compared to those that were investigated because of allegedly illicit trading in stocks. Thus, we repeat the regressions from columns (1) to (5), but we augment the dependent variable to include all litigated cases that involve insider trading around M&As, whether in stocks or options. Our previous conclusions remain largely unchanged. In addition, we do ï¬nd some evidence that cash-ï¬nanced deals are about 1.7 times more likely to be caught up in a civil lawsuit. However, this ï¬nding is not robust against the inclusion of market and trading activity measures. According to our discussions with the regulator, the SEC, being resource constrained, pursues larger-sized cases that provide the biggest “bank for the buck” from a regulatory perspective. Taken at face value, our results are consistent with this interpretation, given that SEC litigation is more likely for deals with large transaction values, which have higher bid prices and a greater offer premium. It is interesting to see that the odds of litigation are higher for deals that are initiated by foreign acquirers. Unfortunately, we cannot identify whether insiders prefer to trade ahead of 50 We also controlled for ABN ORM V OL, the total abnormal volume for the target over the 30 days preceding the announcement, and ABN ORM V OLP , the total abnormal put options volume. The results don’t change. 39
41) transactions involving larger companies, as such companies typically have a more liquid options market, which would allow insiders to better hide their trades. Alternatively, the SEC may be more likely to go after large-scale deals because they are easier to detect and more broadly covered in the ï¬nancial press. We do interpret the higher odds ratios of litigation for deals initiated by foreign bidders as evidence that rogue traders seek to hide behind foreign jurisdictions in order to exploit their private information. Overall, we ï¬nd that the number of civil litigations initiated by the SEC because of illicit option trading ahead of M&As, seems small in light of the pervasiveness of unusual option trading that we have documented to be statistically different from trading activity on any random date. 7 Conclusion Research on trading in individual equity options has been scanty, and even more so when it comes to that centered on major informational events such as M&As. In light of recent investigations into insider trading based on unusual abnormal trading volumes in anticipation of major corporate acquisitions, we investigate the presence of informed option trading around such unexpected public announcements. We focus on equity options written on target and, to a lesser extent, acquirer ï¬rms in the US. Our goal is to quantify the likelihood of informed trading by investigating various options trading strategies, which should, a priori, lead to unusual abnormal trading volumes and returns in the presence of private information. Our analysis of the trading volume and implied volatility over the 30 days preceding formal takeover announcements suggests that informed trading is more pervasive than would be expected based on the actual number of prosecuted cases. We ï¬nd statistically signiï¬cant abnormal trading volumes in call options written on the targets, prior to M&A announcements, with particularly pronounced effects for OTM calls. This evidence is conï¬rmed both overall, and in a sample of strongly unusual trades, where the incentives for informed trading seem particularly striking, given the comparison to the volume of trades in random samples. We provide formal tests of shifts in the bivariate volume-moneyness distribution, and illustrate that the unusual volumes of options trading cannot be replicated in a randomly matched sample. 40
42) We further ï¬nd strong support for positive excess implied volatility for the target companies. In addition, for the targets, the term structure of implied volatility becomes more negative. The evidence from the bid-ask spread is consistent with market makers adjusting their prices to protect themselves from asymmetric information, that has not necessarily leaked to the market. In addition to the analysis for the target companies, we also provide some evidence of unusual option activity for the acquirer companies. Finally, we describe the characteristics of SEC-litigated insider trades in options ahead of M&A announcements, and show that they closely resemble the statistical properties of the unusual pre-event option trading activity. Future analysis, based on the attributes of abnormal volume and excess implied volatility, will lead to a classiï¬cation that should ultimately be reflective of those cases that are most likely to involve insider trading. This investigation may be of particular interest to regulators. References Acharya, V. V., and T. C. Johnson (2007): “Insider trading in credit derivatives,” Journal of Financial Economics, 84(1), 110–141. (2010): “More insiders, more insider trading: Evidence from private-equity buyouts,” Journal of Financial Economics, 98(3), 500–523. Andrade, G., M. Mitchell, and E. Stafford (2001): “New Evidence and Perspectives on Mergers,” The Journal of Economic Perspectives, 15(2), 103–120. Barraclough, K., D. T. Robinson, T. Smith, and R. E. Whaley (2012): “Using Option Prices to Infer Overpayments and Synergies in M&A Transactions,” Review of Financial Studies. Bollen, N. P. B., and R. E. Whaley (2004): “Does Net Buying Pressure Affect the Shape of Implied Volatility Functions?,” The Journal of Finance, 59(2), 711–753. Cao, C., Z. Chen, and J. M. Griffin (2005): “Informational Content of Option Volume Prior to Takeovers,” The Journal of Business, 78(3), 1073–1109. Cao, H. H., and H. Ou-Yang (2009): “Differences of Opinion of Public Information and Speculative Trading in Stocks and Options,” Review of Financial Studies, 22(1), 299–335. Chan, K., L. Ge, and T.-C. Lin (2014): “Informational Content of Option Trading on Acquirer Announcement Return,” Forthcoming, Journal of Financial and Quantitative Analysis. Chesney, M., R. Crameri, and L. Mancini (2011): “Detecting Informed Trading Activities in the Options Markets,” NCCR FINRISK Working Paper No. 560. Deuskar, P., A. Gupta, and M. G. Subrahmanyam (2011): “Liquidity effect in OTC options markets: Premium or discount?,” Journal of Financial Markets, 14(1), 127–160. 41
43) Easley, D., M. O’Hara, and P. S. Srinivas (1998): “Option Volume and Stock Prices: Evidence on Where Informed Traders Trade,” The Journal of Finance, 53(2), 431–465. Fasano, G., and A. Franceschini (1987): “A multidimensional version of the KolmorogovSmirnov test,” Monthly Notices of the Royal Astronomical Society, 225, 155–170. Frino, A., S. Satchell, B. Wong, and H. Zheng (2013): “How much does an Illegal Insider Trade?,” International Review of Finance, 13(2), 241–263. Garleanu, N., L. H. Pedersen, and A. M. Poteshman (2009): “Demand-Based Option Pricing,” Review of Financial Studies, 22(10), 4259–4299. Greenberg, S. L. (2008): “Bivariate Goodness-of-Fit Tests Based on Kolmogorov-Smirnov Type Statistics,” Dissertation for the fulï¬llment of the requirements for the degree Master of Science in Mathematical Statistics, University of Johannesburg. John, K., A. Koticha, R. Narayanan, and M. G. Subrahmanyam (2003): “Margin Rules, Informed Trading in Derivatives and Price Dynamics,” Working Paper New York University, Stern School of Business. Johnson, T. L., and E. C. So (2012): “The option to stock volume ratio and future returns,” Journal of Financial Economics, 106(2), 262–286. Keown, A. J., and J. M. Pinkerton (1981): “Merger Announcements and Insider Trading Activity: An Empirical Investigation,” The Journal of Finance, 36(4), 855–869. Meulbroek, L. K. (1992): “An Empirical Analysis of Illegal Insider Trading,” The Journal of Finance, 47(5), 1661–1699. Nicolau, A. A. (2010): “An Examination of the Behavior of Implied Volatility Around Merger Announcements,” Bachelor of Science Thesis, New York University, Leonard N. Stern School of Business. Podolski, E. J., C. Truong, and M. Veeraraghavan (2013): “Informed options trading prior to takeovers: Does the regulatory environment matter?,” Journal of International Financial Markets, Institutions and Money, 27(0), 286–305. Poteshman, A. M. (2006): “Unusual Option Market Activity and the Terrorist Attacks of September 11, 2001,” The Journal of Business, 79(4), 1703–1726. Press, W., S. Teukolsky, W. Vetterling, and B. Flannery (1992): Numerical recipes in C: The art of scientiï¬c computing. Cambridge University Press, second edn. Savor, P. G., and Q. Lu (2009): “Do Stock Mergers Create Value for Acquirers?,” The Journal of Finance, 64(3), 1061–1097. Spyrou, S., A. Tsekrekos, and G. Siougle (2011): “Informed trading around merger and acquisition announcements: Evidence from the UK equity and options markets,” Journal of Futures Markets, 31(8), 703–726. Wang, X. (2013): “What does the SEC choose to investigate?,” Journal of Economics and Business, 65(0), 14–32. 42
44) Table 1: Descriptive and Financial Overview of M&A Sample Panel A provides an overview of the M&A deal characteristics for all US domestic M&As in the Thomson Reuters SDC Platinum database over the time period January 1996 through December 31, 2012, for which a matching stock, and option price information, were available for the target in, respectively, the CRSP master ï¬le and OptionMetrics based on the 6-digit CUSIP. The sample excludes deals with an unknown or pending deal status, includes only those deals with available deal information, for which the deal value is above 1 million USD and in which an effective change of control was intended. In addition, we require valid price and volume information in both CRSP and OptionMetrics for the target for at least 90 days prior to and on the announcement day. We report the number of deals (No.) and the corresponding sample proportions (% of Tot.). In addition, we report how many of the deals are classiï¬ed as completed, friendly, hostile, involving a target and acquirer in the same industry, challenged, or having a competing bidder, a collar structure, a termination fee or a bidder with a toehold in the target company. All characteristics are reported for the overall sample (column Total ), as well as for different offer structures: cash-ï¬nanced (Cash Only), stock-ï¬nanced (Shares), a combination of cash and stock ï¬nancing (Hybrid ), other ï¬nancing structures (Other ), and unknown (Unknown). Panel B illustrates the ï¬nancial statistics of the deals. We report the transaction value (DVal ) in million USD and the offer premium. P1d (P1w, P4w) refers to the premium, one day (one week, four weeks) prior to the announcement date, in percentage terms. The deal value is the total value of the consideration paid by the acquirer, excluding fees and expenses. The dollar value includes the amount paid for all common stock, common stock equivalents, preferred stock, debt, options, assets, warrants, and stake purchases made within six months of the announcement date of the transaction. Any liabilities assumed are included in the value if they are publicly disclosed. Preferred stock is only included if it is being acquired as part of a 100% acquisition. If a portion of the consideration paid by the acquirer is common stock, the stock is valued using the closing price on the last full trading day prior to the 43 announcement of the terms of the stock swap. If the exchange ratio of shares offered changes, the stock is valued based on its closing price on the last full trading date prior to the date of the exchange ratio change. For public-target 100% acquisitions, the number of shares at the date of announcement is used. The premium paid is deï¬ned as the ratio of the offer price to the target’s closing stock price, one day (one week, four weeks) prior to the original announcement date, expressed as a percentage. Source: Thomson Reuters SDC Platinum. Panel A: Deal Information Offer Structure Cash Only Hybrid Other Shares Unknown Total Description No. % of Tot. No. % of Tot. No. % of Tot. No. % of Tot. No. % of Tot. No. % of Tot. Nbr. of Deals Completed Deals Friendly Deals Hostile Deals Same-Industry Deals Challenged Deals Competing Bidder Collar Deal Termination Fee Bidder has a Toehold 903 746 805 35 379 111 83 4 698 42 48.6% 40.1% 43.3% 1.9% 42.0% 6.0% 4.5% 0.2% 37.5% 2.3% 415 357 379 14 280 55 32 54 352 11 22.3% 19.2% 20.4% 0.8% 67.5% 3.0% 1.7% 2.9% 18.9% 0.6% 80 67 69 3 39 7 3 3 51 2 4.3% 3.6% 3.7% 0.2% 48.8% 0.4% 0.2% 0.2% 2.7% 0.1% 403 339 382 7 268 32 20 52 292 7 21.7% 18.2% 20.5% 0.4% 66.5% 1.7% 1.1% 2.8% 15.7% 0.4% 58 33 42 4 27 11 4 7 29 3 3.1% 1.8% 2.3% 0.2% 46.6% 0.6% 0.2% 0.4% 1.6% 0.2% 1,859 1,542 1,677 63 993 216 142 120 1,422 65 100.0% 82.9% 90.2% 3.4% 53.4% 11.6% 7.6% 6.5% 76.5% 3.5% Panel B: Deal Financials Offer Structure Cash Only Description DVal (mil) P1d P1w P4w Hybrid Other Shares Unknown Total Mean Sd Mean Sd Mean Sd Mean Sd Mean Sd Mean Sd $2,242.0 33.6% 36.6% 41.1% $4,147.2 31.7% 31.0% 35.6% $5,880.9 28.5% 32.4% 35.0% $10,071.5 27.5% 29.1% 32.4% $5,074.2 25.1% 29.5% 31.2% $10,387.7 40.5% 42.5% 46.1% $5,429.8 28.3% 33.6% 36.7% $15,158.5 39.5% 61.5% 45.3% $1,635.7 33.3% 33.4% 38.0% $2,503.7 29.6% 29.8% 33.6% $3,848.4 31.0% 34.7% 38.3% $9,401.3 33.1% 39.8% 37.7%
45) Table 2: Summary Statistics - Option Trading Volume (Without Zero-Volume Observations) Table 2 presents basic summary statistics on option trading volumes, excluding zero-volume observations, stratiï¬ed by time to expiration (TTE) and moneyness (DITM). We report the mean (Mean), the standard deviation (SD), the minimum (Min), the median (Med ), the 75th percentile (p75 ), the 90th percentile (p90 ), and the maximum (Max ). We classify the number of observations N into three groups of time to expiration: less than or equal to 30 days, greater than 30 but less than or equal to 60 days, and more than 60 days. We assign ï¬ve groups for depth-in-moneyness, where depth-in-moneyness is deï¬ned as S/K, the ratio of the stock price S to the strike price K. Deep out-of-themoney (DOTM) corresponds to S/K ∈ [0, 0.80] for calls ([1.20, ∞) for puts), out-of-the-money (OTM) corresponds to S/K ∈ (0.80, 0.95] for calls ([1.05, 1.20) for puts), at-the-money (ATM) corresponds to S/K ∈ (0.95, 1.05) for calls ((0.95, 1.05) for puts), in-the-money (ITM) corresponds to S/K ∈ [1.05, 1.20) for calls ((0.80, 0.95] for puts), and deep in-the-money (DITM) corresponds to S/K ∈ [1.20, ∞) for calls ([0, 0.80] for puts). Panels A to C contain information for all options; Panels D to F report statistics for call options; Panels G to I report statistics for put options. Source: OptionMetrics. Target (N = 2,214,260) DITM Mean SD Min Med Panel A: All options, TTE = [0,30] DOTM (3%) 246 1,973 1 20 OTM (5%) 370 1,990 1 41 ATM (79%) 273 1,291 1 40 ITM (5%) 356 6,214 1 20 DITM (5%) 275 3,264 1 10 Total (100%) 283 2,135 1 35 Panel B: All options, TTE = ]30,60] DOTM (6%) 163 863 1 20 OTM (9%) 285 1,201 1 32 ATM (71%) 184 855 1 25 ITM (6%) 190 3,244 1 20 DITM (6%) 208 5,288 1 10 Total (100%) 194 1,787 1 23 Panel C: All options, TTE = ]60,...] DOTM (25%) 117 1,035 1 15 OTM (24%) 130 847 1 15 ATM (20%) 131 845 1 15 ITM (14%) 99 923 1 10 DITM (15%) 83 1,105 1 10 Total (100%) 115 949 1 13 Panel D: Call options, TTE = [0,30] DOTM (2%) 285 1,914 1 20 OTM (4%) 438 2,266 1 49 ATM (78%) 302 1,461 1 44 ITM (7%) 446 7,363 1 22 DITM (7%) 220 3,161 1 10 Total (100%) 311 2,564 1 37 Panel E: Call options, TTE = ]30,60] DOTM (4%) 168 790 1 20 OTM (8%) 313 1,292 1 37 ATM (70%) 202 923 1 27 ITM (7%) 213 3,828 1 20 DITM (8%) 213 5,967 1 10 Total (100%) 212 2,197 1 25 Panel F: Call options, TTE = ]60,...] DOTM (23%) 108 1,149 1 15 OTM (26%) 124 829 1 15 ATM (20%) 137 931 1 15 ITM (13%) 108 1,083 1 10 DITM (16%) 82 1,249 1 10 Total (100%) 114 1,040 1 12 Panel G: Put options, TTE = [0,30] DOTM (4%) 220 2,010 1 20 OTM (6%) 306 1,689 1 39 ATM (81%) 234 1,003 1 35 ITM (4%) 139 976 1 15 DITM (2%) 485 3,627 1 11 Total (100%) 242 1,275 1 30 Panel H: Put options, TTE = ]30,60] DOTM (9%) 159 915 1 20 OTM (10%) 253 1,084 1 30 ATM (71%) 155 739 1 22 ITM (5%) 136 836 1 15 DITM (3%) 192 1,264 1 12 Total (100%) 166 830 1 21 Panel I: Put options, TTE = ]60,...] DOTM (29%) 129 855 1 15 OTM (22%) 141 880 1 15 ATM (21%) 120 680 1 15 ITM (14%) 84 580 1 11 DITM (12%) 87 669 1 10 Total (100%) 118 769 1 14 44 p75 p90 Max 76 164 152 80 40 138 300 596 531 333 171 500 94,177 88,086 231,204 539,482 200,000 539,482 63 128 95 65 37 90 229 500 328 254 137 316 29,045 55,222 71,822 475,513 523,053 523,053 45 50 50 35 27 42 143 175 180 111 89 142 339,751 101,885 116,416 142,647 137,804 339,751 78 194 171 97 40 150 334 711 592 431 152 545 78,937 83,637 231,204 539,482 200,000 539,482 70 144 100 73 34 96 250 533 363 293 116 342 25,000 36,955 55,208 475,513 523,053 523,053 46 50 50 34 25 41 140 169 182 111 79 139 339,751 101,885 116,416 142,647 137,804 339,751 75 141 130 50 43 120 275 508 455 189 250 431 94,177 88,086 58,819 42,708 100,010 100,010 60 110 80 50 50 80 210 449 280 197 232 284 29,045 55,222 71,822 41,177 54,004 71,822 45 50 50 38 33 44 150 193 175 110 100 150 61,123 83,066 56,000 40,906 70,014 83,066
46) Table 3: Positive Abnormal Trading Volume Panel A reports the number (#) and frequency (freq.) of deals with statistically signiï¬cant positive cumulative abnormal volume at the 5% signiï¬cance level, as well as the the average cumulative abnormal volume (E [CAV ]) and corresponding t-statistic (tCAV ), computed using heteroscedasticity-robust standard errors. We use two different ¯ models to calculate abnormal volume: the market model and the constant-mean model. For the market model, the market option volume is deï¬ned as either the mean or the median of the total daily trading volume across all options (respectively calls or puts) in the OptionMetrics database. All results are reported separately for call options, put options, and for the aggregate option volume. The estimation window starts 90 days before the announcement date and runs until 30 days before the announcement date. The event window stretches from 30 days before until one day before the announcement date. Panel B reports the same statistics as in Panel A, disaggregated by the consideration structure of the M&A transaction. We report results separately for cash-ï¬nanced and stock-ï¬nanced transactions. Panel C reports the results of t-tests for the differences in the average cumulative abnormal volumes across moneyness categories: out-of-the-money (OTM), in-the-money (ITM), and at-the-money (ATM). We report the difference in average cumulative abnormal volume (Diff), the standard error (s.e.) and the p-value (p-val). Panel A Market Model (Median) Option Type All All Options - Target Sign.t-stat 5% (#) 462 Sign.t-stat 5% (freq.) 0.25 E [CAV ] 15266.93 tCAV 5.19 ¯ OTM Options - Target Sign.t-stat 5% (#) 405 Sign.t-stat 5% (freq.) 0.22 E [CAV ] 5650.09 tCAV 5.27 ¯ ATM Options - Target Sign.t-stat 5% (#) 298 Sign.t-stat 5% (freq.) 0.16 E [CAV ] 1246.45 tCAV 1.85 ¯ ITM Options - Target Sign.t-stat 5% (#) 358 Sign.t-stat 5% (freq.) 0.19 E [CAV ] 2804.58 tCAV 4.91 ¯ Market Model (Mean) Constant-Mean Model Calls Puts All Calls Puts All Calls Puts 490 0.26 11969.28 5.69 271 0.15 3471.78 3.70 455 0.24 12955.74 4.33 472 0.25 10202.45 4.70 276 0.15 2688.79 2.72 467 0.25 14904.28 5.12 492 0.26 11546.02 5.51 319 0.17 3357.93 3.59 383 0.21 3797.47 5.52 387 0.21 1859.50 4.04 394 0.21 5271.57 5.56 383 0.21 3581.55 5.56 397 0.21 1689.58 4.07 462 0.25 5477.21 5.58 572 0.31 3662.97 5.58 591 0.32 1814.23 4.25 300 0.16 1059.16 2.34 254 0.14 188.04 0.79 278 0.15 1246.45 1.14 283 0.15 753.14 1.45 255 0.14 129.54 0.49 408 0.22 1307.18 1.92 420 0.23 1059.04 2.27 498 0.27 248.14 1.00 448 0.24 1701.87 7.08 316 0.17 1109.71 2.45 354 0.19 2724.04 5.15 434 0.23 1644.19 7 317 0.17 1057.57 2.52 424 0.23 2791.03 5.18 596 0.32 1694.86 7.10 619 0.33 1096.17 2.53 132 0.15 3,850 2.45 223 0.25 16,567 3.32 239 0.26 12,779 3.60 133 0.15 3,827 2.46 237 0.26 17,106 3.38 252 0.28 13,157 3.67 162 0.18 3,950 2.47 56 0.14 3,048 1.69 103 0.26 9,530 2.47 108 0.27 9,457 3.25 56 0.14 -325 -0.15 103 0.26 12,089 3.01 112 0.28 10,975 3.66 68 0.17 1,112 0.71 Panel B CASH DEALS - All Options - Target Sign.t-stat 5% (#) 234 247 Sign.t-stat 5% (freq.) 0.26 0.27 E [CAV ] 17,110 13,239 tCAV 3.45 3.79 ¯ STOCK DEALS - All Options - Target Sign.t-stat 5% (#) 103 109 Sign.t-stat 5% (freq.) 0.26 0.27 E [CAV ] 14,993 11,840 tCAV 2.75 3.19 ¯ Panel C Statistics All Options - Target OTM-ATM OTM-ITM ATM-ITM Call Options - Target OTM-ATM OTM-ITM ATM-ITM Put Options - Target OTM-ATM OTM-ITM ATM-ITM Diff s.e. p-val Diff s.e. p-val Diff s.e. p-val 4403.64 2845.51 -1558.13 995.00 679.97 768.04 0.00 0.00 0.04 4414.89 2547.53 -1867.35 1001.70 625.35 870.18 0.00 0.00 0.03 4170.03 2686.17 -1483.86 965.00 644.32 803.99 0.00 0.00 0.07 2738.31 2095.60 -642.71 640.40 609.21 454.39 0.00 0.00 0.16 2828.41 1937.35 -891.06 697.69 577.47 514.97 0.00 0.00 0.08 2603.93 1968.11 -635.82 655.36 587.85 462.95 0.00 0.00 0.17 1671.46 749.79 -921.67 478.39 300.46 500.32 0.00 0.01 0.07 1560.04 632.01 -928.03 443.08 313.97 499.72 0.00 0.04 0.06 1566.10 718.06 -848.04 449.78 310.18 498.29 0.00 0.02 0.09 45
47) Table 4: Bivariate Kolmogorov-Smirnov Tests - Target Each entry in Table 4 represents the test statistic from a generalization of the bivariate two-sample Kolmogorov Smirnov test based on Fasano and Franceschini (1987). The null hypothesis of the test is that two bivariate samples come from the same empirical distribution function. The bivariate distribution of trading volume is compared across different event-time windows of ï¬ve consecutive days (except for the announcement window, which contains a single day, and the event window immediately preceding it, which contains only four days): The ï¬rst event window stretches from t = −29 to t = −25 ([−29, −25]) and the last from t = −4 to t = −1 ([−4, −1]). We also compare every event-time window against the announcement day ([0, 0]). Panel A contains the results for call options and Panel B contains the results for put options. For each group, we report the results from subsamples based on the time to expiration (TTE): less than or equal to 30 days, greater than 30 but less than or equal to 60 days, and more than 60 days. ∗∗∗ , ∗∗ and ∗ denote statistical signiï¬cance at the 1%, 5% and 10% level, respectively. 46 Event Window [−29, −25] [−24, −20] [−19, −15] [−14, −10] [−9, −5] [−4, −1] [−24, −20] 0.0279∗∗∗ . . . . . [−19, −15] 0.0482∗∗∗ 0.0228∗∗∗ . . . . Event Window [−29, −25] [−24, −20] [−19, −15] [−14, −10] [−9, −5] [−4, −1] [−24, −20] 0.0348 . . . . . [−19, −15] 0.1255∗∗∗ 0.1212∗∗∗ . . . . Event Window [−29, −25] [−24, −20] [−19, −15] [−14, −10] [−9, −5] [−4, −1] [−24, −20] 0.0605∗∗∗ . . . . . [−19, −15] 0.0859∗∗∗ 0.0390∗∗ . . . . Event Window [−29, −25] [−24, −20] [−19, −15] [−14, −10] [−9, −5] [−4, −1] [−24, −20] 0.0227∗∗∗ . . . . . [−19, −15] 0.0323∗∗∗ 0.0165∗ . . . . Panel A: Calls Full Sample [−14, −10] [−9, −5] 0.0616∗∗∗ 0.1007∗∗∗ 0.0368∗∗∗ 0.0744∗∗∗ 0.0173∗∗ 0.0556∗∗∗ . 0.0410∗∗∗ . . . . TTE = [0,30] [−14, −10] [−9, −5] 0.2157∗∗∗ 0.2750∗∗∗ 0.2121∗∗∗ 0.2645∗∗∗ 0.0979∗∗∗ 0.1667∗∗∗ . 0.0979∗∗∗ . . . . TTE = ]30,60] [−14, −10] [−9, −5] 0.0905∗∗∗ 0.1341∗∗∗ 0.0453∗∗∗ 0.0874∗∗∗ 0.0246 0.0628∗∗∗ . 0.0554∗∗∗ . . . . TTE = [60,...] [−14, −10] [−9, −5] 0.0364∗∗∗ 0.0675∗∗∗ ∗∗∗ 0.0210 0.0503∗∗∗ 0.0158∗ 0.0390∗∗∗ . 0.0350∗∗∗ . . . . [−4, −1] 0.1592∗∗∗ 0.1334∗∗∗ 0.1134∗∗∗ 0.0988∗∗∗ 0.0606∗∗∗ . [0, 0] 0.4070∗∗∗ 0.3911∗∗∗ 0.3694∗∗∗ 0.3581∗∗∗ 0.3256∗∗∗ 0.2798∗∗∗ [−24, −20] 0.0331∗∗∗ . . . . . [−19, −15] 0.0414∗∗∗ 0.0209∗∗ . . . . [−4, −1] 0.3388∗∗∗ 0.3340∗∗∗ 0.2377∗∗∗ 0.1700∗∗∗ 0.0867∗∗∗ . [0, 0] 0.6102∗∗∗ 0.6093∗∗∗ 0.5105∗∗∗ 0.4408∗∗∗ 0.3607∗∗∗ 0.2854∗∗∗ [−24, −20] 0.0318 . . . . . [−19, −15] 0.1246∗∗∗ 0.1280∗∗∗ . . . . [−4, −1] 0.1843∗∗∗ 0.1421∗∗∗ 0.1111∗∗∗ 0.1050∗∗∗ 0.0611∗∗∗ . [0, 0] 0.4324∗∗∗ 0.3925∗∗∗ 0.3746∗∗∗ 0.3605∗∗∗ 0.3232∗∗∗ 0.2885∗∗∗ [−24, −20] 0.0670∗∗∗ . . . . . [−19, −15] 0.0975∗∗∗ 0.0465∗∗ . . . . [−4, −1] 0.1195∗∗∗ 0.1009∗∗∗ 0.0885∗∗∗ 0.0853∗∗∗ 0.0549∗∗∗ . [0, 0] 0.3897∗∗∗ 0.3763∗∗∗ 0.3623∗∗∗ 0.3599∗∗∗ 0.3324∗∗∗ 0.2883∗∗∗ [−24, −20] 0.0293∗∗∗ . . . . . [−19, −15] 0.0309∗∗∗ 0.0288∗∗∗ . . . . Panel A: Puts Full Sample [−14, −10] [−9, −5] 0.0382∗∗∗ 0.0607∗∗∗ 0.0242∗∗∗ 0.0403∗∗∗ 0.0176∗ 0.0301∗∗∗ . 0.0295∗∗∗ . . . . TTE = [0,30] [−14, −10] [−9, −5] 0.1978∗∗∗ 0.2886∗∗∗ 0.1978∗∗∗ 0.2893∗∗∗ 0.1003∗∗∗ 0.1752∗∗∗ . 0.0961∗∗∗ . . . . TTE = ]30,60] [−14, −10] [−9, −5] 0.0907∗∗∗ 0.1228∗∗∗ 0.0430∗ 0.0672∗∗∗ 0.0353 0.0484∗∗∗ . 0.0619∗∗∗ . . . . TTE = [60,...] [−14, −10] [−9, −5] 0.0264∗∗ 0.0371∗∗∗ ∗∗∗ 0.0288 0.0337∗∗∗ 0.0187 0.0184∗ . 0.0175 . . . . [−4, −1] 0.0820∗∗∗ 0.0677∗∗∗ 0.0524∗∗∗ 0.0561∗∗∗ 0.0389∗∗∗ . [0, 0] 0.2760∗∗∗ 0.2657∗∗∗ 0.2549∗∗∗ 0.2564∗∗∗ 0.2351∗∗∗ 0.2132∗∗∗ [−4, −1] 0.3400∗∗∗ 0.3407∗∗∗ 0.2280∗∗∗ 0.1484∗∗∗ 0.0653∗∗∗ . [0, 0] 0.5275∗∗∗ 0.5266∗∗∗ 0.4149∗∗∗ 0.3397∗∗∗ 0.2509∗∗∗ 0.2104∗∗∗ [−4, −1] 0.1355∗∗∗ 0.0896∗∗∗ 0.0747∗∗∗ 0.0983∗∗∗ 0.0514∗∗ . [0, 0] 0.3370∗∗∗ 0.3047∗∗∗ 0.2895∗∗∗ 0.3094∗∗∗ 0.2729∗∗∗ 0.2361∗∗∗ [−4, −1] 0.0657∗∗∗ 0.0553∗∗∗ 0.0487∗∗∗ 0.0454∗∗∗ 0.0361∗∗∗ . [0, 0] 0.2706∗∗∗ 0.2703∗∗∗ 0.2525∗∗∗ 0.2534∗∗∗ 0.2429∗∗∗ 0.2235∗∗∗
48) Table 5: Strongly Unusual Trading (SUT) Sample and Matched Random Sample Panel A presents sample statistics for the strongly unusual trading (SUT) sample, reflecting four selection criteria: (1) the best bid price of the day is zero, (2) non-zero volume, (3) option expiration after the announcement date, and (4) transaction within the 30 days prior to the announcement date. Panel B presents comparative statistics for a sample randomly selected from the entire dataset, where for each event we choose a pseudo event date and then apply the same selection criteria as for the SUT sample. Both panels contain statistics for the aggregate sample, as well as separately for call and put options. We report the number of observations (Obs), the corresponding number of unique announcements (# Deals) and unique option classes (# Options), the average (Mean vol) and median (Med vol) trading volume, followed by the percentiles of the distribution as well as the minimum and maximum observations. Panel C shows results for the one- and two-sided Kolmogorov-Smirnov (KS) tests for the difference in distributions, and the one- and two-sided tests for differences in means (T-test). The statistical tests are carried out for the samples including both call and put options. HO denotes the null hypothesis of each test, Statistic denotes the test statistic type (D-distance for the KS test and t-statistic for the t-test),Value indicates the test-statistic value, and p-val the p-value of the test. 47 Panel A: SUT selection with the historical 1,859 event dates for the target - zero bid Target Obs # Deals # Options Mean vol Med vol Min vol 1st pctile 5th pctile 25th pctile All 2,042 437 1,243 123.78 20 1 1 1 6 Calls 1,106 299 570 137.23 20 1 1 1 5 Puts 936 316 673 107.9 20 1 1 1 7.5 Panel B: One random sample of 1,859 pseudo event dates for the target Target Obs # Deals # Options Mean vol Med vol Min vol 1st pctile 5th pctile 25th pctile All 3,412 574 1,901 57 10 1 1 1 5 Calls 1,813 351 941 64 11 1 1 1 5 Puts 1,599 387 960 49 10 1 1 1 5 Panel C: Tests for statistical signiï¬cance between SUT and random sample with all options Target KS (two-sided) KS (one-sided) KS (one-sided) T-test (mean) H0: SUT=RS SUT≤ RS SUT≥ RS SUT=RS Statistic D D D t Value 0.12 0.12 1.00 -6.90 p-val 2.80e-12 4.14e-17 1.00 5.99e-12 75th pctile 62 65 60 95th pctile 479 543 390 99th pctile 2,076 2,517 1,494 Max vol 13,478 6,161 13,478 75th pctile 32 40 30 95th pctile 200 232 182 99th pctile 813 893 759 Max vol 5,000 5,000 3,000 T-test (mean) SUT≤ RS t -6.90 2.99e-12 T-test (mean) SUT≥ RS t -6.90 1.00
49) Table 6: Zero-Volume Runs Table 6 reports sample proportions of observations that have more than, respectively, 0, 100, 500 and 1,000 option contracts (for instance, P (Vt > 0)). The proportions are reported for the overall sample, and for categories stratiï¬ed by depth-in-moneyness. We assign ï¬ve groups for depth-in-moneyness, which is deï¬ned as S/K, the ratio of the stock price S to the strike price K. Deep out-of-the-money (DOTM) corresponds to S/K ∈ [0, 0.80] for calls ( [1.20, ∞) for puts), out-of-the-money (OTM) corresponds to S/K ∈ (0.80, 0.95] for calls ([1.05, 1.20) for puts), at-themoney (ATM) corresponds to S/K ∈ (0.95, 1.05) for calls ( (0.95, 1.05) for puts), in-the-money (ITM) corresponds to S/K ∈ [1.05, 1.20) for calls ((0.80, 0.95] for puts), and deep in-the-money (DITM) corresponds to S/K ∈ [1.20, ∞) for calls ([0, 0.80] for puts). Panel A reports sample statistics for March 5, 2003. Panel B reports statistics for our entire sample. Panel C reports statistics for the ï¬ve days preceding the actual announcement days (t ∈ [−5, −1]), as well as for the ï¬ve days preceding random pseudo-event dates. Ech comparison indicates the number of standard deviations that the random proportion is away from the actual proportion. Panel C also reports proportions of observations that have more than, respectively, 0, 100, 500 and 1,000 option contracts, conditional on zero trading volume on the preceding day, respectively during the ï¬ve preceding days. DOTM OTM ATM ITM DITM Full Sample 28,402 17,319 12,052 17,319 28,404 103,496 0.1064 0.0193 0.0038 0.0021 0.2718 0.0641 0.0172 0.0083 0.3022 0.0720 0.0241 0.0128 0.1524 0.0243 0.0059 0.0035 0.0539 0.0046 0.0011 0.0004 0.1502 0.0297 0.0080 0.0042 3,411,873 1,428,467 2,380,397 1,428,286 3,412,545 12,061,568 P (Vt > 0) 0.1033 P (Vt ≥ 100) 0.0155 P (Vt ≥ 500) 0.0040 P (Vt ≥ 1000) 0.0022 Panel C: t ∈ [−5, −1] - Actual vs. Random N 78,424 NRS 34,508 0.2581 0.0474 0.0138 0.0076 0.3487 0.0879 0.0270 0.0144 0.1584 0.0220 0.0062 0.0034 0.0688 0.0071 0.0018 0.0010 0.1668 0.0320 0.0093 0.0050 32,500 15,185 27,074 21,066 32,540 15,192 78,436 34,553 248,974 120,504 P (Vt > 0) 0.3681 0.2519 33 0.0165 0.0052 19 0.2734 0.1852 28 0.0121 0.0037 17 0.1499 0.1029 19 0.0067 0.0020 13 0.0799 0.0583 11 0.0036 0.0014 7 0.4265 0.3239 32 0.0260 0.0110 21 0.2766 0.2120 23 0.0163 0.0073 15 0.1155 0.0910 12 0.0063 0.0035 7 0.0481 0.0371 8 0.0025 0.0015 4 0.2408 0.1502 31 0.0067 0.0024 11 0.2034 0.1260 29 0.0054 0.0021 9 0.1429 0.0892 23 0.0038 0.0018 6 0.1004 0.0623 19 0.0023 0.0011 5 0.0922 0.0695 17 0.0023 0.0008 10 0.0859 0.0647 16 0.0022 0.0008 9 0.0746 0.0559 15 0.0020 0.0007 9 0.0650 0.0485 14 0.0017 0.0007 7 0.1913 0.1554 34 0.0078 0.0036 24 0.1521 0.1201 34 0.0058 0.0027 21 0.1006 0.0765 31 0.0035 0.0016 16 0.0705 0.0518 29 0.0022 0.0010 13 Panel A: March 5, 2003 N P (Vt > 0) P (Vt ≥ 100) P (Vt ≥ 500) P (Vt ≥ 1000) Panel B: Full Sample N P (Vt ≥ 1000) P (Vt > 0|Vt−1 = 0) P (Vt ≥ 1000|Vt−1 = 0) P (Vt > 0| 3 i=1 P (Vt ≥ 1000| P (Vt > 0| 5 i=1 P (Vt ≥ 1000| Vt−i = 0) 3 i=1 Vt−i = 0) Vt−i = 0) 5 i=1 Vt−i = 0) Actual Random # SD away Actual Random # SD away Actual Random # SD away Actual Random # SD away Actual Random # SD away Actual Random # SD away Actual Random # SD away Actual Random # SD away 0.1155 0.0982 11 0.0038 0.0016 10 0.1037 0.0882 10 0.0034 0.0016 8 0.0835 0.0711 9 0.0027 0.0012 8 0.0676 0.0568 9 0.0021 0.0009 7 48
50) 49 -1.37 (2.75) 3.32** (1.32) 6.37*** (1.51) -5.58* (2.91) 0.12 (1.98) 7.23** (2.96) 5.65*** (1.83) 3.04 (2.34) -2.45 (1.85) (1) CABV OLC 1,858 0.07 YES GLS NO 0.06 Constant Observations R-squared YEAR FE SE CLUSTER adj.R2 MKTVOL ARUNUP TTPRET1 TANNRET TRUNUP ADVISORS SALES PRICE PREM1D US FRIENDLY TERM COLLAR PRIVATE TOE CASH SIZE VARIABLES 1,858 0.07 YES GLS YES 0.06 -1.37 (2.79) 3.32** (1.34) 6.37*** (1.53) -5.58* (2.94) 0.12 (1.97) 7.23** (2.94) 5.65*** (1.83) 3.04 (2.36) -2.45 (1.91) (2) CABV OLC 1,829 0.07 YES GLS NO 0.05 -2.33 (3.16) 0.40 (0.52) 2.89** (1.44) 6.59*** (1.55) -5.93** (2.99) 0.07 (2.05) 7.33** (2.99) 5.67*** (1.87) 3.08 (2.47) -2.56 (1.89) (3) CABV OLC 1,829 0.07 YES GLS YES 0.05 -2.33 (3.23) 0.40 (0.52) 2.89** (1.44) 6.59*** (1.57) -5.93** (3.02) 0.07 (2.04) 7.33** (2.96) 5.67*** (1.89) 3.08 (2.48) -2.56 (1.94) (4) CABV OLC 1,806 0.07 YES GLS NO 0.06 -0.90 (2.84) 6.99*** (1.51) -5.63* (3.01) -0.58 (1.96) 6.91** (2.99) 5.63*** (1.87) 3.97* (2.40) -2.44 (1.86) -0.05** (0.02) 0.01 (0.02) 3.32** (1.36) (5) CABV OLC 1,806 0.07 YES GLS YES 0.06 -0.90 (2.89) 6.99*** (1.52) -5.63* (3.01) -0.58 (1.95) 6.91** (2.96) 5.63*** (1.87) 3.97 (2.41) -2.44 (1.91) -0.05** (0.02) 0.01 (0.02) 3.32** (1.37) (6) CABV OLC 1,858 0.13 YES GLS NO 0.12 -0.84 (2.76) 23.93*** (2.71) 0.91 (4.61) -8.03** (3.99) -4.92 (4.39) 2.50** (1.27) 5.63*** (1.51) -3.43 (2.70) 0.10 (1.91) 6.49** (2.89) 4.65*** (1.79) 2.00 (2.30) -1.74 (1.83) (7) CABV OLC at the 1%, 5% and 10% level, respectively. Source: Thomson Reuters SDC Platinum, CRSP, OptionMetrics. ∗∗∗ , ∗∗ 1,858 0.13 YES GLS YES 0.12 -0.84 (2.81) 23.93*** (2.86) 0.91 (4.58) -8.03** (4.08) -4.92 (4.25) 2.50* (1.29) 5.63*** (1.53) -3.43 (2.71) 0.10 (1.91) 6.49** (2.85) 4.65*** (1.80) 2.00 (2.29) -1.74 (1.88) ∗ 1,858 0.14 YES GLS NO 0.12 24.30*** (2.72) 0.57 (4.60) -7.84** (3.98) -4.52 (4.40) -3.85** (1.93) 15.25* (8.60) 2.44* (1.27) 5.49*** (1.52) -3.38 (2.70) 0.06 (1.91) 6.47** (2.89) 4.57** (1.79) 1.91 (2.30) -1.71 (1.82) 1,858 0.14 YES GLS YES 0.12 24.30*** (2.88) 0.57 (4.56) -7.84* (4.08) -4.52 (4.27) -3.85** (1.95) 15.25* (8.66) 2.44* (1.29) 5.49*** (1.54) -3.38 (2.71) 0.06 (1.91) 6.47** (2.85) 4.57** (1.80) 1.91 (2.30) -1.71 (1.88) (10) CABV OLC denote statistical signiï¬cance (9) CABV OLC and (8) CABV OLC adjusted R-squared. Standard errors are robust (GLS) and possibly clustered (CLUSTER) by announcement day. announcement day. Each regression contains year ï¬xed effects (YEAR FE). We report the number of observations (Observations), the R-squared and the return, and ARU N U P is the abnormal stock return for the acquirer before the announcement day. M KT V OL is the market volume on the day before the for the target, T AN N RET denotes the target’s announcement abnormal return, T T P RET 1 refers to the target’s post-announcement cumulative abnormal The total number of target and acquirer advisors is indicated by ADV ISORS. T RU N U P denotes the pre-announcement cumulative abnormal stock return P RICE denotes the price per common share paid by the acquirer in the transaction. SALES denotes the target’s net sales over the previous 12 months. P REM 1D refers to the premium of offer price to target closing stock price one day prior to the original announcement date, expressed as a percentage. F RIEN DLY has the value one if the deal attitude is considered to be friendly, and U S is one if the bidder is a US-based company, and zero otherwise. takes the value one for transactions with a collar structure, T ERM is one for deals that have a termination fee that applies if the takeover negotiations fail, the value one if a bidder already has a toehold in the target company, P RIV AT E equals one if the acquirer privatizes the target post-acquisition, COLLAR SIZE quantiï¬es the M&A deal value. CASH is a categorical value taking the value one if the deal is a cash-ï¬nanced takeover and zero otherwise, T OE has of M&A characteristics and market activity measures. Cumulative abnormal volume is standardized by the average normal volume from the event window. Table 7 reports generalized least squares (GLS) regression results from the projection of cumulative abnormal call option log-volume (CABV OLC ) on a set Table 7: Cumulative Abnormal Volume Regressions - Call Options with Scaled Volume
51) Table 8: Positive Excess Implied Volatility Panel A in this table reports the results from a classical event study in which we test whether there was statistically signiï¬cant positive excess implied volatility in anticipation of the M&A announcements. Two different models are used: excess implied volatility relative to a constant-mean-volatility model, and a market model, in which we use as the market-implied volatility the CBOE S&P500 Volatility Index (VIX). The estimation window starts 90 days before the announcement date and runs until 30 days before it. The event window stretches from 30 days before until one day before the announcement date. Panel A reports the number (#) and frequency (freq.) of events with statistically signiï¬cant positive excess implied volatility at the 5% signiï¬cance level. The results are illustrated separately for the 30-day at-the-money (ATM), in-the-money (ITM) and out-of-the-money (OTM) implied volatility, deï¬ned as, respectively, 50, 80 and 20 delta (δ) options in absolute value. Panel A Market Model (VIX) Option Type Constant-Mean Model Calls Calls Puts 794 0.43 766 0.41 712 0.38 762 0.41 772 0.42 668 0.36 Puts 30-day ATM Implied Volatility (|δ| = 50) - Target Sign.t-stat 5% (#) 812 798 Sign.t-stat 5% (freq.) 0.44 0.43 30-day ITM Implied Volatility (|δ| = 80) - Target Sign.t-stat 5% (#) 733 756 Sign.t-stat 5% (freq.) 0.39 0.41 30-day OTM Implied Volatility (|δ| = 20) - Target Sign.t-stat 5% (#) 791 671 Sign.t-stat 5% (freq.) 0.43 0.36 50
52) Table 9: Summary Statistics for Acquirer - Option Trading Volume Table 9 presents basic summary statistics on option trading volumes for the acquirer companies, excluding zerovolume observations, stratiï¬ed by time to expiration (TTE) and moneyness (DITM). We report the mean (Mean), the standard deviation (SD), the minimum (Min), the median (Med ), the 75th percentile (p75 ), the 90th percentile (p90 ), and the maximum (Max ). We classify the number of observations N into three groups of time to expiration: less than or equal to 30 days, greater than 30 but less than or equal to 60 days, and more than 60 days. We assign ï¬ve groups for depth-in-moneyness, deï¬ned as S/K, the ratio of the stock price S to the strike price K. Deep out-of-themoney (DOTM) corresponds to S/K ∈ [0, 0.80] for calls ( [1.20, ∞) for puts), out-of-the-money (OTM) corresponds to S/K ∈ (0.80, 0.95] for calls ([1.05, 1.20) for puts), at-the-money (ATM) corresponds to S/K ∈ (0.95, 1.05) for calls ( (0.95, 1.05) for puts), in-the-money (ITM) corresponds to S/K ∈ [1.05, 1.20) for calls ((0.80, 0.95] for puts), and deep in-the-money (DITM) corresponds to S/K ∈ [1.20, ∞) for calls ([0, 0.80] for puts). Panels A to C contain information for all options; Panels D to F report statistics for call options; Panels G to I report statistics for put options. Source: OptionMetrics. Acquirer (N = 3,582,394) DITM Mean SD Min Med Panel A: All options, TTE = [0,30] DOTM (10%) 127 594 1 20 OTM (22%) 497 1,497 1 79 ATM (26%) 1,084 3,038 1 204 ITM (23%) 398 5,209 1 42 DITM (16%) 214 3,286 1 16 Total (100%) 547 3,361 1 52 Panel B: All options, TTE = ]30,60] DOTM (14%) 141 838 1 20 OTM (27%) 384 1,388 1 69 ATM (25%) 551 1,666 1 101 ITM (20%) 236 3,488 1 30 DITM (12%) 334 12,543 1 11 Total (100%) 354 4,841 1 41 Panel C: All options, TTE = ]60,...] DOTM (24%) 112 774 1 20 OTM (25%) 193 1,072 1 26 ATM (18%) 208 927 1 28 ITM (15%) 106 678 1 17 DITM (15%) 80 1,774 1 10 Total (100%) 145 1,082 1 20 Panel D: Call options, TTE = [0,30] DOTM (6%) 96 434 1 13 OTM (21%) 523 1,572 1 75 ATM (25%) 1,285 3,598 1 244 ITM (24%) 499 6,595 1 50 DITM (23%) 192 3,379 1 17 Total (100%) 603 4,143 1 50 Panel E: Call options, TTE = ]30,60] DOTM (9%) 123 907 1 20 OTM (27%) 425 1,471 1 72 ATM (24%) 657 1,934 1 123 ITM (21%) 297 4,480 1 33 DITM (17%) 349 14,251 1 11 Total (100%) 412 6,386 1 42 Panel F: Call options, TTE = ]60,...] DOTM (19%) 111 744 1 20 OTM (27%) 199 1,167 1 28 ATM (18%) 214 954 1 30 ITM (15%) 110 753 1 17 DITM (20%) 75 1,976 1 10 Total (100%) 147 1,231 1 20 Panel G: Put options, TTE = [0,30] DOTM (14%) 145 672 1 24 OTM (25%) 468 1,410 1 83 ATM (29%) 855 2,210 1 166 ITM (21%) 249 1,670 1 32 DITM (8%) 294 2,915 1 13 Total (100%) 471 1,846 1 54 Panel H: Put options, TTE = ]30,60] DOTM (21%) 152 795 1 22 OTM (27%) 332 1,277 1 65 ATM (26%) 424 1,263 1 81 ITM (18%) 145 700 1 24 DITM (6%) 281 1,989 1 13 Total (100%) 280 1,168 1 40 Panel I: Put options, TTE = ]60,...] DOTM (31%) 114 802 1 19 OTM (23%) 181 871 1 24 ATM (19%) 200 885 1 25 ITM (16%) 101 555 1 16 DITM (9%) 94 735 1 11 Total (100%) 142 796 1 20 51 p75 p90 Max 71 355 927 175 54 279 231 1,207 2,744 624 191 1,146 27,377 55,167 198,146 679,620 300,841 679,620 76 269 425 108 40 183 245 830 1,299 367 133 659 95,000 94,552 90,497 458,019 1,609,002 1,609,002 59 100 108 53 30 67 176 328 382 164 86 224 137,430 246,507 88,131 125,027 582,500 582,500 49 361 1,106 215 58 283 185 1,281 3,239 750 192 1,233 18,553 55,167 198,146 679,620 300,841 679,620 70 296 528 128 39 200 225 935 1,593 432 119 741 95,000 53,060 90,497 458,019 1,609,002 1,609,002 63 106 115 56 28 70 187 347 398 171 80 230 137,430 246,507 88,131 125,027 582,500 582,500 90 349 750 130 47 274 260 1,128 2,185 465 188 1,050 27,377 40,432 77,874 184,584 105,004 184,584 81 244 315 83 52 165 250 716 1,010 271 203 570 45,195 94,552 32,239 45,470 80,401 94,552 53 88 100 50 35 64 163 296 355 152 102 214 100,103 78,492 71,516 39,420 63,051 100,103
53) 52 Panel A: SUT selection with the historical 792 event dates for the acquirer Acquirer Obs # Deals # Options Mean vol Med vol Min vol 1st pctile All 5,343 235 1,035 1045.85 202 1 1 Calls 2,860 228 534 1257.00 244 1 1 Puts 2,483 223 501 802.65 163 1 1 Panel B: One random sample of 792 pseudo event dates for the acquirer Acquirer Obs # Deals # Options Mean vol Med vol Min vol 1st pctile All 2,258 127 479 657.79 145 1 1 Calls 1,206 120 244 758.42 198 1 1 Puts 1,052 119 235 542.42 110 1 1 Panel C: Tests for statistical signiï¬cance between SUT and random sample Target KS (two-sided) KS (one-sided) KS (one-sided) H0: SUT=RS SUT≤ RS SUT≥ RS Statistic D D D Value 0.09 0.09 0.00 p-val 2.69e-11 1.34e-11 1.00 p-val the p-value of the test. Source: OptionMetrics 25th pctile 35 38 32 5th pctile 5 4 5 (T-test mean) SUT=RS t -5.72 1.12e-08 25th pctile 30 35 25 5th pctile 5 4 5 95th pctile 2,925 3,263 2,434 95th pctile 4,783 5,465 3,858 T-test (mean) SUT≤ RS t -5.72 5.61e-09 75th pctile 584 700 469 75th pctile 1,020 1,276 774 Max vol 25,855 23,425 25,855 Max vol 164,439 164,439 16,486 T-test (mean) SUT≥ RS t -5.72 1.00 99th pctile 7,749 9,215 5,903 99th pctile 10,927 12,110 7,939 hypothesis of each test, Statistic the test statistic type (D-distance for the KS test and t-statistic for the T-test),Value indicates the test-statistic value, and two-sided tests for differences in means (T-test). The statistical tests are carried out for the samples including both call and put options. HO denotes the null maximum observations. Panel C shows results for the one- and two-sided Kolmogorov-Smirnov (KS) tests for the difference in distributions, and the one- and classes (# Options), the average (Mean vol) and median (Med vol) trading volume, followed by the percentiles of the distribution as well as the minimum and for call and put options. We report the number of observations (Obs), the corresponding number of unique announcements (# Deals) and unique option event date and then apply the same selection criteria as for the SUT sample. Both panels contain statistics for the aggregate sample, as well as separately announcement date. Panel B presents comparative statistics for a sample randomly selected from the entire dataset, where for each event we choose a pseudo [0.95; 1.05]), (2) there is non-zero volume, (3) the option expires after the announcement date, and (4) the transaction occurs within the 30 days prior to the Panel A presents sample statistics for the strongly unusual trading (SUT) sample, reflecting four selection criteria: (1) the option trades ATM (S/K ∈ Table 10: Strongly Unusual Trading (SUT) Sample and Matched Random Sample - Acquirer
54) 53 ∗ in Year 1990 1993 1994 1995 1996 1997∗ 1998 1999 2000 2001 2002 2003 2004 2005 2006 2007 2008 2009 2010 2011 2012 2013 90-13 96-12 CRSP. SEC LRs 1 2 5 3 2 4 7 0 7 2 1 2 2 8 9 14 5 6 11 4 4 3 5 6 Cash 0 0 2 2 1 1 3 0 4 1 0 0 2 4 7 10 4 3 9 1 3 3 2 2 ABS Sample . . . . 70 133 175 217 164 86 36 54 72 109 119 159 98 74 93 114 86 . . 109 Illicit Proï¬ts 350,000 87,593 141,456 377,113 527,500 185,830 339,588 . 150,996 300,000 250,000 452,871 1,221,753 1,478,949 586,125 2,219,556 595,769 8,751,193 409,832 902,457 4,191,446 3,200,000 1,470,056 1,567,976 Fines . 60,474 365,100 779,102 1,770,000 106,341 2,128,255 . 193,561 . 61,714 1,017,857 5,963,326 971,151 827,605 12,489,449 1,223,737 762,375 2,830,969 324,777 324,422 500,000 3,539,593 3,770,741 Days to Lit. . 1,427 953 1,987 202 288 460 . 1,356 2,813 933 670 497 1,162 490 879 849 1,031 463 537 91 12 770 756 Moneyness S/K . . 0.90 . 0.93 1.02 0.97 . 1.09 0.96 . 0.91 0.90 0.97 0.94 0.92 0.95 0.87 0.95 0.80 1.11 0.96 0.94 0.94 Option Mat. . . 1 . 1 2 1 . 1 0 . 1 1 1 1 2 2 1 1 3 1 2 1 1 Days to Ann. . 20 4 50 2 3 7 . 4 0 72 13 6 18 10 21 15 21 19 21 17 4 16 16 Defend. 1 5 3 12 . 2 2 . 2 . 4 3 . 3 3 2 2 2 2 6 2 1 3 3 period, 1996 to 2012, that we cover in our analysis of unusual option trading. Source: Thomson Reuters SDC Platinum, Securities and Exchange Commission, The last two columns show the sample averages over the entire period for which we have information on SEC litigations, as well as over the shorter sample the ï¬rst column means that the year contains a litigation report for the acquiring company. In total, there is only one case involving the acquirer in a deal. days between the ï¬rst unusual option trade and the announcement date. The last column, Defend., shows the average yearly number of defendants. A column Option Mat. presents the average time to maturity (in months) of the traded options, and the column Days to Ann. reports the average number of and the ï¬rst ï¬led litigation report. The column Moneyness S/K provides information about the average moneyness of the prosecuted option trades. The trading proï¬ts, prejudgment interest and civil penalty, if any). The column Days to Lit. denotes the average number of days between the announcement date of illicit proï¬ts reaped in the litigated cases and the column Fines reports the average yearly ï¬ne imposed in the litigations (total amount including disgorged cash-ï¬nanced (if the information is available). The column ABS Sample refers to our sample of M&A deals. The column Illicit Proï¬ts is the average number column SEC LRs indicates the number of SEC litigation reports by calendar year (Year ). The column Cash indicates the number of litigated deals that are (SEC) in federal court. We extract and document all the litigations that encompass trading in stock options around M&A and takeover announcements. The Table 11 provides summary statistics on a subsample of litigation releases concerning civil lawsuits brought by the Securities and Exchange Commission Table 11: SEC Litigation Reports
55) 54 (2) Logit (Odds Ratio) -5.85*** (0.00) 1,859 YES 0.16 Observations Year FE ps.R-squared 1,830 YES 0.16 -5.86*** (0.00) 0.04 (1.04) 0.81*** (2.26) 0.33 (1.39) -0.66 (0.52) 3.02** (20.49) -1.07 (0.34) 0.2 (1.22) 0.77 (2.17) 0.5 (1.64) -0.49 (0.61) -0.53* (0.59) 0.86*** (2.35) 0.31 (1.37) -0.64 (0.53) 3.07** (21.54) -1.08 (0.34) 0.24 (1.27) 0.77 (2.16) 0.51 (1.67) -0.48 (0.62) -0.55* (0.58) , 1,801 YES 0.19 -6.59*** (0.00) 0.62** (1.86) 0.37 (1.44) -0.78 (0.46) 3.46** (31.94) -1.1 (0.33) 0.24 (1.27) 0.77 (2.16) 0.52 (1.69) -0.54 (0.58) -0.57* (0.56) 0.01*** (1.01) 0.01** (1.01) 0.04*** (1.04) 1,859 YES 0.19 -6.12*** (0.00) -0.72 (0.48) -0.9 (0.41) 2.44*** (11.44) -0.1 (0.9) 1.06*** (2.88) 0.14 (1.15) -0.51 (0.6) 3.11** (22.4) -1.03 (0.36) 0.34 (1.41) 0.61 (1.84) 0.45 (1.57) -0.43 (0.65) -0.56* (0.57) (4) Logit (Odds Ratio) 1,859 YES 0.19 -0.73 (0.48) -0.9 (0.41) 2.44*** (11.48) -0.1 (0.91) 0.00 (1.00) 0.00 (1.00) -6.08*** (0.00) 1.04*** (2.84) 0.14 (1.15) -0.52 (0.59) 3.09** (21.93) -1.02 (0.36) 0.34 (1.4) 0.61 (1.84) 0.45 (1.57) -0.44 (0.64) -0.54* (0.58) (5) Logit (Odds Ratio) 1,859 YES 0.10 -4.51*** (0.01) 0.65*** (1.91) 0.51** (1.67) -0.76* (0.47) 0.6 (1.83) -0.54 (0.58) 0 (1.00) -0.14 (0.87) 0.29 (1.33) 0.49 (1.63) -0.19 (0.83) (6) Logit (Odds Ratio) 1,830 YES 0.10 -4.65*** (0.01) 0.02 (1.02) 0.65*** (1.92) 0.55** (1.73) -0.76* (0.47) 0.48 (1.61) -0.79 (0.45) -0.01 (0.99) -0.14 (0.87) 0.28 (1.32) 0.74 (2.09) -0.19 (0.83) (7) Logit (Odds Ratio) 1,801 YES 0.12 -4.88*** (0.01) 0.52** (1.69) 0.51** (1.66) -0.86** (0.42) 0.5 (1.66) -0.78 (0.46) 0.04 (1.05) -0.18 (0.83) 0.29 (1.34) 0.74 (2.09) -0.24 (0.78) 0.01*** (1.01) 0.00* (1.00) 0.02* (1.02) (8) Logit (Odds Ratio) 1,859 YES 0.13 -4.68*** (0.01) 0.15 (1.16) -1.11* (0.33) 2.57*** (13.05) -0.21 (0.81) 0.78*** (2.19) 0.28 (1.32) -0.76* (0.47) 0.57 (1.77) -0.47 (0.62) 0.17 (1.19) -0.28 (0.75) 0.23 (1.26) 0.49 (1.63) -0.22 (0.8) (9) Logit (Odds Ratio) 1,859 YES 0.13 0.19 (1.21) -1.14** (0.32) 2.57*** (13.01) -0.19 (0.83) 0.00 (1.00) 0.00 (1.00) -4.60*** (0.01) 0.79*** (2.20) 0.28 (1.32) -0.75* (0.47) 0.57 (1.76) -0.47 (0.62) 0.16 (1.17) -0.28 (0.76) 0.21 (1.24) 0.51 (1.67) -0.22 (0.8) (10) Logit (Odds Ratio) and ∗ denote statistical signiï¬cance at the 1%, 5% and 10% level. Source: Thomson Reuters SDC Platinum, (3) Logit (Odds Ratio) ∗∗∗ ∗∗ (1) Logit (Odds Ratio) Constant ABNORMVOLC MKTVOL ARUNUP TTPRET1 TANNRET TRUNUP ADVISORS SALES PRICE PREM1D US FRIENDLY TERM COLLAR PRIVATE TOE COMPLETE CHALLENGE CASH SIZE VARIABLES CRSP, OptionMetrics. and the pseudo R-squared (ps.R-squared). announcement abnormal volumes for calls and puts. All speciï¬cations have year ï¬xed effects (Year FE ). We report the number of observations (Observations) ABN ORM V OL is the target’s total abnormal volume over the 30 pre-announcement days. ABN ORM V OLC and ABN ORM V OLP are the 30-day pre- return. ARU N U P is the acquirer pre-announcement abnormal stock return. M KT V OL denotes the market volume on the day before the announcement. stock return. T AN N RET denotes the target’s announcement abnormal return. T T P RET 1 indicates the target’s post-announcement cumulative abnormal months. The total number of target and acquirer advisors is given by ADV ISORS. T RU N U P denotes the target’s pre-announcement cumulative abnormal date, expressed as a percentage. P RICE denotes the price per common share paid by the acquirer. SALES is the target’s net sales over the previous 12 if the bidder is a US-based company. P REM 1D refers to the premium of offer price to target closing stock price one day prior to the original announcement COLLAR for transactions with a collar structure, T ERM for deals with termination fees, F RIEN DLY if the deal attitude is considered to be friendly, U S for completed transactions, T OE if a bidder already has a toehold in the target company, P RIV AT E if the acquirer privatized the target post-acquisition, takes value one for deals greater than the median M&A deal value, CASH for cash-ï¬nanced takeovers, CHALLEN GE for challenged deals, COM P LET E (10) correspond to those involving both options and stocks. The explanatory variables take the value one if a condition is met, and zero otherwise: SIZE the deal has been litigated and zero otherwise. Columns (1) to (5) correspond to all SEC-litigated insider trading cases involving options; columns (6) to Table 12 reports the logit coefficients from the logistic regressions and the odds ratios in parentheses. The dependent variable SEC takes the value one if Table 12: SEC Predictability Regressions
56) Figure 1: Trading Volumes around Announcement Dates Figure 1 illustrates the daily average option trading volume around the M&A announcement, from 60 days before to 60 days after the announcement date. Figures (1a) and (1b) plot the average call trading volume for, respectively, the acquirer and the target. Figures (1c) and (1d) plot the average put trading volume for, respectively, the acquirer and the target. The bars represent the average daily trading volume across all M&A deals, where for each deal, the daily volume reflects the total aggregated volume across all traded options. Volume is deï¬ned as the number of option contracts. Source: OptionMetrics. (a) (b) (c) (d) 55
57) Figure 2: Abnormal Trading Volumes Before Announcement Dates Figure (2a) plots the average abnormal trading volume for, respectively, all equity options (solid line), call options (dashed line) and put options (dotted line), over the 30 days preceding the announcement date. Volume is deï¬ned as the number of option contracts. Figure (2b) reflects the average cumulative abnormal trading volume for all options (solid line), call options (dashed line) and put options (dotted line) over the same event period. Figures (2c) and (2d) plot the average abnormal and cumulative abnormal trading volume for call options in M&A transactions that are either cash-ï¬nanced (solid line) or stock-ï¬nanced (dashed line), over the 30 days preceding the announcement date. Source: OptionMetrics. (a) -30 -20 -10 0 Event Time All Call 10000 15000 Average Cumulative Abnormal Volume 5000 2000 1500 1000 500 0 Average Abnormal Volume (# Contracts) Average Abnormal Volume 0 Average Cumulative Abnormal Volume (# Contracts) (b) -30 -20 Put All Average Abnormal Volume (# Contracts) 1000 1500 0 500 2000 Average Abnormal Volume - Call Options -20 -10 0 Event Time Cash 0 Call Put (d) Average Cumulative Abnormal Volume (# Contracts) 0 5000 10000 15000 (c) -30 -10 Event Time Stock Average Cumulative Abnormal Volume - Call Options -30 -20 -10 Event Time Cash 56 Stock 0
58) Figure 3: Volume vs. Depth-in-Moneyness across Event Windows Figure 3 shows local polynomial functions ï¬tted to the volume-depth distribution across seven different event windows and for the full sample (excluding the event windows). Figures (3a) and (3b) show the polynomial ï¬ts for, respectively, call and put options on the target companies. Volume is deï¬ned as the number of option contracts. Depth-inmoneyness is deï¬ned as S/K, the ratio of the stock price S to the strike price K. Deep out-of-the-money (DOTM - solid line) corresponds to S/K ∈ [0, 0.80] for calls ( [1.20, ∞) for puts), out-of-the-money (OTM - dashed-dotted line) corresponds to S/K ∈ (0.80, 0.95] for calls ([1.05, 1.20) for puts), at-the-money (ATM - dashed-double-dotted line) corresponds to S/K ∈ (0.95, 1.05) for calls ( (0.95, 1.05) for puts), in-the-money (ITM - dotted) corresponds to S/K ∈ [1.05, 1.20) for calls ((0.80, 0.95] for puts), and deep in-the-money (DITM - dash-triple-dot) corresponds to S/K ∈ [1.20, ∞) for calls ([0, 0.80] for puts). Volume is winsorized at the upper 99th percentile. Figures (3c) and (3d) replicate Figures (3a) and (3a), but omit the announcement effect. Source: OptionMetrics. (a) (b) Put Options - Target Volume (# Contracts) - Polynomial Fit 50 150 0 100 Volume (# Contracts) - Polynomial Fit 0 20 40 60 80 100 Call Options - Target 0 .5 1 S/K Full Sample ex-EW [-14,-10] [-29,-25] [-9,-5] 1.5 [-24,-20] [-4,-1] 2 0 .5 [-19,-15] [0,0] Full Sample ex-EW [-14,-10] Call Options - Target .5 1 S/K Full Sample ex-EW [-24,-20] [-14,-10] [-4,-1] [-29,-25] [-9,-5] 1.5 [-24,-20] [-4,-1] 2 [-19,-15] [0,0] (d) 1.5 Volume (# Contracts) - Polynomial Fit 0 10 20 30 Volume (# Contracts) - Polynomial Fit 0 60 20 40 (c) 0 1 S/K 2 [-29,-25] [-19,-15] [-9,-5] Put Options - Target 0 .5 1 S/K Full Sample ex-EW [-24,-20] [-14,-10] [-4,-1] 57 1.5 [-29,-25] [-19,-15] [-9,-5] 2
59) Figure 4: Trading Volume Distribution around Announcement Dates Figure 4 plots distributional statistics of the options trading volume, deï¬ned as the number of traded contracts, from 30 days before until 20 days after the announcement date. The left axis on each subï¬gure plots the 90th (dashed line) and the 95th (solid line) percentiles of the volume distribution, while the right axis on each subï¬gure refers to the interquartile range (dotted line). Figures (4a) and (4b) refer to, respectively, the call and put volumes for the target companies. Source: OptionMetrics. (a) (b) -30 -20 -10 0 Event Time 90th percentile 95th percentile 10 40 60 Volume (# Contracts) 500 1000 1500 80 100 120 Interquartile Range 140 2000 Put Options Volume Distribution - Target 0 0 50 100 150 Interquartile Range Volume (# Contracts) 500 1000 1500 200 2000 Call Options Volume Distribution - Target 20 -30 -20 Interquartile Range 90th percentile -10 0 Event Time 95th percentile 10 20 Interquartile Range Figure 5: Excess Implied Volatility Before Announcement Dates Figure 5 plots, for the target companies, the average excess implied volatility relative to the VIX index for the 30-day at-the-money (ATM) implied volatility from, respectively, call (dashed line) and put (solid line) options, over the 30 days preceding the announcement date. Source: OptionMetrics. .01 .02 .03 .04 .05 Average Excess Implied Volatility -30 -20 -10 Event Time Call 58 Put 0
60) Figure 6: Information Dispersion - Bid-Ask Spreads Figure (6a) illustrates the evolution of the average percentage bid-ask spread from 90 days before the announcement date to 90 days after the announcement date. Figure (6b) replicates the evolution of the average percentage bidask spread, and compares it against the evolution of the average percentage bid-ask calculated for randomly chosen announcement dates. Figure (6c) illustrates a stratiï¬cation by depth-in-moneyness. We assign ï¬ve groups for depthin-moneyness, which is deï¬ned as S/K, the ratio of the stock price S to the strike price K. Deep out-of-the-money (DOTM - solid line) corresponds to S/K ∈ [0, 0.80] for calls ( [1.20, ∞) for puts), out-of-the-money (OTM - dasheddotted line) corresponds to S/K ∈ (0.80, 0.95] for calls ([1.05, 1.20) for puts), at-the-money (ATM - dashed-doubledotted line) corresponds to S/K ∈ (0.95, 1.05) for calls ( (0.95, 1.05) for puts), in-the-money (ITM - dotted line) corresponds to S/K ∈ [1.05, 1.20) for calls ((0.80, 0.95] for puts), and deep in-the-money (DITM - dashed-tripledotted line) corresponds to S/K ∈ [1.20, ∞) for calls ([0, 0.80] for puts). Source: OptionMetrics. (a) (b) Percentage Bid-Ask Spread, Target .7 .6 .5 .4 Percentage Bid-Ask Spread .7 .6 .5 .3 .4 Percentage Bid-Ask Spread .8 .8 Percentage Bid-Ask Spread, Target .3 -80 -60 -40 0 20 40 60 80 Event Time -80 -60 -40 -20 0 20 40 60 80 Actual Event Time (c) Random (d) 0 .8 .6 .4 .2 .5 1 1.5 Percentage Bid-Ask Spread 1 Percentage Bid-Ask Spread, Target 2 Percentage Bid-Ask Spread, Target Percentage Bid-Ask Spread -20 -100 -50 0 50 100 -100 -50 Event Time DOTM OTM ATM 0 50 100 Event Time ITM DITM 59 TTE = [0,30] TTE = ]30,60] TTE = ]60,...]
61) Figure 7: Implied Volatility Smile and Term Structure The graphs in Figure 7 characterize the evolution of implied volatility (IV) around M&A announcement dates. Each node represents the cross-sectional average within a time window deï¬ned on the x-axis. Figure (7a) plots two measures of IV skewness: the difference between OTM IV for calls with a delta of 20 and ATM IV for calls with a delta of 50 (left axis); the difference between ITM IV for puts with a delta of -80 and ATM IV for puts with a delta of -50 (right axis). Figure (7b) plots the evolution of two additional IV skewness measures for the target: the difference between OTM IV for puts with a delta of 25 and OTM IV for calls with a delta of 25, scaled by the average ATM IV with a delta of 50 (left axis); the difference between OTM IV for puts with a delta of 20 and ATM IV for calls with a delta of 50 (right axis). Figure (7c) depicts the IV term structure for call options, deï¬ned as the difference between the ATM IV of call options (delta = 50) with respectively 91 and 30 days to maturity (left axis), and the IV term structure for put options, deï¬ned as the difference between the ATM IV of put options (delta = 50) for respectively 91 and 30 days to maturity (left axis). For each graph, we compare the actual averages to those computed from randomly selected announcement dates. Source: OptionMetrics. IV-Skew (30-day options) IV-Skew (30-day options) [21,25] [31,...[ ]...,-30] Call-Skew Random (Mean) Put-Skew Random (Mean) [-24,-20] [-14,-10] [-4,-1] [1,5] Event Time Carr-Wu (Mean) Cremers et al. (Mean) (c) IV-delta50/91 - IV-delta50/30 -.03 -.02 -.04 -.01 IV-Term Structure (91day - 30day options) -.05 Call-Skew (Mean) Put-Skew (Mean) [11,15] .04 .012 [-4,-1] [1,5] Event Time .05 .06 .07 .08 IVp-delta20 - IVc-delta50 (IVp-delta25 - IVc-delta25)/delta50 .01 .02 .03 .04 .05 .06 .014 .016 .018 IVp-delta80 - IVp-delta50 .04 IVc-delta20 - IVc-delta50 .02 .035 .025 .03 .015 ]...,-30] [-24,-20] [-14,-10] .09 (b) .02 (a) ]...,-30] [-24,-20] [-14,-10] [-4,-1] [1,5] Event Time IV-Term Calls (Mean) IV-Term Puts (Mean) [11,15] [21,25] [31,...[ IV-Term Calls Random (Mean) IV-Term Puts Random (Mean) 60 [11,15] [21,25] [31,...[ Carr-Wu Random (Mean) Cremers et al. Random (Mean)
62) Figure 8: Straddle Trading Volume Figure 8 characterizes the evolution of straddle pairs and trading volume around M&A announcement dates. Figure (8a) plots the evolution of the average (left scale) and total (right scale) number of straddle trading strategies for the acquirer. Figure (8b) reports the evolution of the average (left scale) and total (right scale) straddle trading volume for, respectively, the target and the acquirer. For each deal on each day, we identify call-put pairs (CP pairs) that are written on the same underlying stock and that have identical strike prices and times to expiration. For each CP pair, the lower volume of either the call or put option reflects an upper bound on the number of implementable straddle trading strategies. Source: OptionMetrics. Straddle Pairs - Acquirer Straddle Volume - Acquirer 1500 1200 1300 # Pairs Volume - # Contracts 400 600 1400 2 1.8 # Pairs 1000 200 1100 1.6 1.4 -30 -20 -10 0 Event Time Average 10 20 -30 Total -20 -10 0 Event Time Average 61 10 Total 20 100000 200000 300000 400000 500000 Volume - # Contracts (b) 800 (a)
63) Internet Appendix 62
64) A A Taxonomy of Insider Trading Strategies To obtain a high level classiï¬cation of potential insider trading strategies, we need to distinguish between insider trading strategies on the target and those on the acquirer. An investor trading illicitly, based on private information, would gain most from bullish strategies on the target company (or alternatively a replication of such a strategy carried out by shorting bearish strategies), and from strategies that are long rising volatility on the acquirer ï¬rms (or alternatively a replication of such a strategy by shorting strategies that beneï¬t from falling volatility). Any replicating strategy that involves the underlying could also be created by investing in the futures contract on the underlying. We will omit such possibilities in what follows as we have no means to get speciï¬c information on such futures contracts. We will likewise not talk about the obvious strategy of investing directly in the stock only. A.1 Target Insider trading on the target is only proï¬table for long bullish strategies. These strategies can also usually be replicated by shorting bearish strategies in a dynamic fashion. We discuss each possibility one by one. A.1.1 Long Bullish Strategies 1. Long Call The simplest form of exploiting inside information using options is to buy plain vanilla and short-dated deep OTM call options on the underlying stock, given that they provide the biggest leverage to the investor.51 This implies that we should observe abnormal trading volume in call options prior to M&A announcements. The abnormal trading volume should be relatively higher for OTM options in comparison to ATM and ITM options. Moreover, the call-to-stock volume ratio should increase ahead of the announcement. The cost of this strategy will be equal to the option premium. 2. Long Call Ratio Backspread A call ratio backspread consists of selling a call option with strike K1 and buying two call options with strike K2 , where K1 < K2 . The advantage is that by selling one call option for every two purchased, part of the strategy is self-ï¬nancing. Similar to the simple long call strategy, the long call ratio backspread provides the most leverage if it is constructed using OTM options. Hence we would expect abnormal trading volume in OTM call options in comparison to ATM and ITM options.52 Moreover, the call-to-stock volume ratio should increase ahead of the announcement. The cost of this strategy will be equal to the option 51 Of course, the options should not be too far OTM, since the stock may not move that much, even after the announcement. 52 The implication also applies to the relative volumes of more OTM to less OTM calls. 63
65) premium. (Note that this strategy could be replicated more cost efficiently by selling a put option with strike K1 , shorting the underlying, and buying two call options with strike K2 , where K1 < K2 . Such a strategy would be more cost efficient as selling the ITM put and shorting the stock would bring in more money than selling the OTM call.) 3. Long Bull Call Spread An insider may be certain about the direction of the stock price, but he could reasonably assume that the stock was going to rise by no more than a certain percentage. In that case, he could engage in a long bull call spread. Such a strategy is constructed by buying a call option with strike K1 and selling a call option with strike K2 , where K1 < K2 . Similarly to the long call ratio backspread, this strategy would be partly self-ï¬nancing. If we assume that leverage is optimized and the call options are OTM, then we would expect abnormal trading volumes in call options ahead of takeover announcements. Such abnormal trading volumes should be relatively higher for OTM options than ATM and ITM options. Moreover, the call-to-stock volume ratio should increase ahead of announcements. (Note that this strategy could be replicated more cost efficiently by selling a put option with strike K2 , shorting the underlying, and buying one call option with strike K1 , where K1 < K2 . Such a strategy would be more cost efficient for a ï¬nancially constrained investor as selling the ITM put and shorting the stock would bring in more money than selling the OTM call. ) 4. Long Bull Put Spread A bull put spread can be implemented by buying a put option with strike K1 and selling a put option with strike K2 , where K1 < K2 . This would be most proï¬table if the investor transacted in ITM puts, thus creating the hypothesis that we ought to see an abnormal trading volume in ITM puts ahead of an announcement. Under this hypothesis, we should also see an increase in the put-to-stock trading volume ratio. The advantage of this strategy is that the purchase of an ITM put is ï¬nanced with a relatively more ITM (and therefore more expensive) put. This strategy should therefore be entirely self-ï¬nancing. (Note that this strategy can be replicated by buying a put option with strike K1 , selling a call option with strike K2 , where K1 < K2 , and buying the underlying stock. In this case, we would also expect a higher abnormal trading volume in OTM call options and in ITM put options.) A.1.2 Short Bearish Strategies 1. Long Put + Stock According to put-call parity, a long call position can be replicated by a position in a put on the same underlying with equal strike and equal time to maturity, combined with a position on the underlying stock. As the greatest leverage is obtained from OTM call options, this strategy can be replicated by buying ITM put options and matching them with the underlying stock. 64
66) According to this hypothesis, we should observe abnormal trading volume in both puts and stocks. Accordingly, the abnormal volume should be relatively higher for ITM put options compared to ATM and ITM puts. In addition, the put to stock volume ratio should not be signiï¬cantly affected. This strategy, however, would be signiï¬cantly less attractive for a capital constrained investor, relative to a simple OTM call transaction, as the ITM puts are comparatively more expensive and the stock is fully funded. The cost of this strategy will be determined by the put premium and the stock price. 2. Short Put If the investor is certain about the direction of the stock price movement, he can simply take advantage of his private information by selling ITM put options. When stock prices do shoot up after an announcement, the put options will expire worthless, whereas the writer of the options will have a proï¬t equal to the put premium times the number of puts sold. This strategy could also be replicated by taking a short position in matched-strike OTM call options together with a long position in the underlying stock (which would correspond to a covered call). 3. Sell Put Ratio Backspread A short put ratio backspread is implemented by selling two puts with strike K1 and buying one put option with strike K2 , where K1 < K2 . While this strategy suggests that there would be a range of contingent outcomes from which the insider could beneï¬t, the strategy is much riskier than others as he could lose money beyond a certain rise in prices. While we expect such a strategy to be an unlikely choice for insider trading, it would generate abnormal trading volumes in ITM put options. (A replication strategy with two short puts at K1 , long a call at K2 and short the stock would have different predictions for the option-to-stock trading volume ratio, and would also suggest an abnormal trading volume in OTM calls. ) 4. Sell Bear Call Spread The idea of selling a bear call spread is similar to the idea of selling ITM puts, except that the proï¬t potential is diminished relative to simple ITM put options. This is thus another unlikely strategy, but a theoretically possible one. A short bear call spread is constructed by selling a call with strike K2 and buying a call with strike K1 , where K1 < K2 . In terms of expectations for trading volumes, such a strategy would raise the OTM call trading volume. 5. Sell Bear Put Spread Finally a short bear put spread is very similar to the short bear call spread, except that it is constructed using puts rather than calls. The composition contains a short position in a put option with strike K2 and a long position in a put option with strike K1 . As this strategy is also similar to the idea of selling ITM puts, except that the proï¬t potential is diminished 65
67) relative to simple ITM put options, we again ï¬nd such a strategy unlikely but theoretically feasible. In any case, the prediction is that we should expect an increase in the abnormal volume for ITM put options. A.2 Acquirer In M&As, the outcome of the stock price evolution for the acquirer company is more uncertain than for the target company, which, on average, has a positive stock price evolution. On the other hand, the takeover announcement is typically associated with an increase in volatility. We therefore expect that an insider would trade on his private information by adopting long neutral price strategies that would beneï¬t from a rise in volatility. Alternatively, he could adopt short neutral price strategies that would beneï¬t from a fall in volatility. A.2.1 Long Rising Volatility Strategies 1. Long Straddle An insider, uncertain about the evolution of the stock price of the acquirer but certain about a rise in volatility, could take advantage of his private information through a long position in a straddle. A straddle is constructed by buying a call and put option on the same underlying with the same strike price. Such a strategy beneï¬ts most from a rise in volatility if both options are purchased ATM. Thus, we would expect to see a relatively stronger increase in the trading volumes for pairs of calls and puts with the same strike and the same time to maturity (most likely short-dated options). This should result in a relatively higher abnormal trading volume for the acquirer for ATM options compared to ITM and OTM options, irrespectively of whether we look at calls or puts. The cost of this strategy is determined by the price of the ATM call and put options. In its simplest form, there should be an increase in both the call-to-stock and the put-to-stock trading volume ratios. There are several ways to replicate this strategy. For example, it would be possible to buy two ATM calls and short the underlying stock. Alternatively, one could buy two ATM puts and add the underlying stock. The former strategy would be more desirable for capitalconstrained investors as the purchase of ATM options could be ï¬nanced through the short sale of the underlying stock. With respect to the latter replication, the trader would need to buy the put options and the underlying stock. In addition, in the case of a shortsale of the underlying, the defensive argument that the trader was speculating may be more reasonable. Regardless, no matter which strategy we are looking at, we should expect an increase in abnormal trading volumes for ATM call and put options. In both cases, the ratio of calls/puts to the underlying stock is two, implying that we should see an increase in both the call-to-stock and the put-to-stock trading volume, just as in the basic straddle strategy. 2. Long Strangle 66
68) A strangle is similar to a straddle, but it may be less costly to implement. It can be constructed by buying a call option with strike K1 and a put option with a strike K2 , where K1 < K2 . The optimal way to implement this strategy in the case of insider trading would be to buy near-the-money options. This means that both the options would be only weakly OTM. Hence, we can argue that we would expect an increase in abnormal trading volumes for ATM options if we deï¬ne ATM through a delta range between, for example, 45% and 55% (or a stock-to-strike ratio between 95% and 105%). There exist several variants of the strangle. One could buy a put option with strike K1 and a call option with strike K2 , where K1 < K2 . The outcome for the trading volume would be similar to the basic case. Alternatively, it is possible to buy one put at strike K1 , one put at strike K2 , and the stock. In this case, the put-to-stock ratio should increase, but not the call-to-stock ratio. However, one would expect to see an abnormal trading volume in ATM puts. It is also possible to replicate the strangle by buying one call at strike K1 , one call at strike K2 , and shorting the stock. Likewise, the ratio of call-to-stock volumes should increase, and we would expect an abnormal trading volume for ATM calls. 3. Long Strap An interesting alternative for an insider, who is uncertain about the stock price outcome for the acquirer, would be to take a long position in a strap. He would thereby beneï¬t from a rise in volatility, but keep a higher proï¬t potential should the stock price rise. A strap, if inside information existed, would be optimally constructed by buying two ATM calls and one ATM put. This would again lead to the prediction that there should be an abnormal trading volume in ATM options. In addition, there should be a relative increase in the ratio of the call-to-put trading volumes. A variant to this strategy would be to buy 3 three ATM calls and short the underlying. This would increase the trading volume in ATM call options, increase the ratio of call-to-put trading volumes, and increase the ratio of call-to-stock volumes. 4. Long Strip A strip is essentially the mirror image of a strap. A long strip trading strategy beneï¬ts from a rise in the volatility of the underlying stock price, but its value increases relatively more if the stock price goes down. The strategy can be optimally constructed (in the presence of private information) by buying two ATM puts and one ATM call. This would also predict a positive abnormal trading volume in ATM options. In addition, there should be a relative increase fo the ratio of the put-to-call trading volumes. A variant to this strategy would be to buy three ATM puts and long the underlying. This would increase the trading volume in ATM put options, decrease the ratio of call-to-put trading volumes, and increase the ratio of put-to-stock volumes. 67
69) A.2.2 Short Falling Volatility Strategies Strategies that beneï¬t from falling volatility are implemented by taking the mirror image positions of those strategies that beneï¬t from a rise in volatility. In other words, such strategies can be implemented by selling a straddle, strangle, strip or strap. As an insider would need to go short on such positions, he would end up with the simple long straddles, strangles, strips and straps. There is therefore no need to investigate any further strategies. We can simply refer to the strategies in section A.2.1. A.3 Conclusion The insight from the exercise of classifying potential insider trading strategies for the acquirer and the target companies is the following: no matter which strategy we look at, the conclusion is that, in the presence of insider information, there should be abnormal trading volumes for the target companies in OTM call options and ITM put options. Meanwhile, there should be an abnormal trading volume in ATM options written on the acquirer. Conditional on such ï¬ndings, the ratios of call-to-stock, put-to-stock and call-to-put volumes may yield insights regarding which strategy is implemented by the insider. 68
70) 69 Offer Structure Cash Only (48%) Hybrid (22%) Other (4%) Shares (21%) Unknown (3%) Total (100%) N≤pctile Mean $2,242.0 $5,880.9 $5,074.2 $5,429.8 $1,635.7 $3,848.4 1,460 Sd $4,147.2 $10,071.5 $10,387.7 $15,158.5 $2,503.7 $9,401.3 - Min $3.0 $34.5 $24.4 $30.4 $16.8 $3.0 1 P1 $58.8 $76.3 $24.4 $57.7 $16.8 $48.2 18 P5 $143.4 $234.1 $158.7 $128.4 $49.7 $141.3 92 P10 $206.2 $393.3 $232.1 $192.8 $102.4 $222.2 185 Deal Transaction Value P25 P50 P75 $417.0 $1,012.2 $2,247.4 $885.7 $2,433.9 $5,981.8 $476.7 $1,326.5 $4,502.7 $424.5 $1,128.4 $3,169.5 $250.0 $489.1 $2,318.7 $468.7 $1,245.4 $3,270.3 464 930 1,396 P90 $5,139.0 $13,528.9 $12,391.7 $10,020.8 $4,232.6 $7,953.6 1,674 P95 $7,811.2 $25,818.3 $26,459.1 $24,517.7 $7,486.2 $14,391.7 1,766 P99 $25,065.2 $56,307.0 $58,511.8 $75,563.2 $13,608.4 $53,414.6 1,841 Max $52,177.7 $67,285.7 $58,511.8 $164,746.9 $13,608.4 $164,746.9 1,859 change. For public target 100% acquisitions, the number of shares on the date of announcement is used. Source: Thomson Reuters SDC Platinum. N 903 415 80 403 58 1,859 - the exchange ratio of shares offered changes, the stock is valued based on its closing price on the last full trading date prior to the date of the exchange ratio acquirer is common stock, the stock is valued using the closing price on the last full trading day prior to the announcement of the terms of the stock swap. If are publicly disclosed. Preferred stock is only included if it is being acquired as part of a 100% acquisition. If a portion of the consideration paid by the warrants, and stake purchases made within six months of the announcement date of the transaction. Any liabilities assumed are included in the value if they excluding fees and expenses. The dollar value includes the amount paid for all common stock, common stock equivalents, preferred stock, debt, options, assets, indicates the number of deals below the ith percentile for the overall sample. The deal value is the total value of the consideration paid by the acquirer, of the distribution (P1 to P99 ), and the maximum (Max ). The last column (N ) indicates the number of deals in each group. The last row (N≤ pctile) and unknown (Unknown). We report the average transaction value (Mean), the standard deviation (SD), the minimum (Min), the 1st to the 99th percentiles (column Total ), cash-ï¬nanced (Cash Only), stock-ï¬nanced (Shares), a combination of cash and stock ï¬nancing (Hybrid ), other ï¬nancing structures (Other ), Table A.1 reports the deal size distribution in million USD of all 1,859 M&A cases, stratiï¬ed by the consideration structure of the deal: the overall sample Table A.1: Deal Size Distribution
71) Table A.2: Positive Abnormal Trading Volume - LOG SCALE Panel A reports the number (#) and frequency (freq.) of deals with statistically signiï¬cant positive cumulative abnormal volume at the 5% signiï¬cance level, as well as the the average cumulative abnormal volume (E [CAV ]) and corresponding t-statistic (tCAV ), computed using heteroscedasticity-robust standard errors. We use two different ¯ models to calculate abnormal volume: the market model and the constant-mean model. For the market model, the market option volume is deï¬ned as either the mean or the median of the total daily trading volume across all options (respectively calls or puts) in the OptionMetrics database. All results are reported separately for call options, put options, and for aggregate option volume. The estimation window starts 90 days before the announcement date and runs until 30 days before the announcement date. The event window stretches from 30 days before until one day before the announcement date. Panel B reports the same statistics as in Panel A, disaggregated by the consideration structure of the M&A transaction. We report results separately for cash-ï¬nanced and stock-ï¬nanced transactions. Panel C reports the results of t-tests for the differences in the average cumulative abnormal volumes across moneyness categories: out-of-the-money (OTM), in-the-money (ITM), and at-the-money (ATM). We report the difference in average cumulative abnormal volume (Diff), the standard error (s.e.) and the p-value (p-val). Panel A Market Model (Median) Option Type All All Options - Target Sign.t-stat 5% (#) 700 Sign.t-stat 5% (freq.) 0.38 E [CAV ] 10.46 tCAV 16.01 ¯ OTM Options - Target Sign.t-stat 5% (#) 405 Sign.t-stat 5% (freq.) 0.22 E [CAV ] 5650.09 tCAV 5.27 ¯ ATM Options - Target Sign.t-stat 5% (#) 298 Sign.t-stat 5% (freq.) 0.16 E [CAV ] 1246.45 tCAV 1.85 ¯ ITM Options - Target Sign.t-stat 5% (#) 358 Sign.t-stat 5% (freq.) 0.19 E [CAV ] 2804.58 tCAV 4.91 ¯ Market Model (Mean) Constant Mean Model Calls Puts All Calls Puts All Calls Puts 720 0.39 12.00 18.06 487 0.26 5.07 9.16 688 0.37 9.78 14.63 698 0.38 11.27 16.61 473 0.25 4.31 7.65 729 0.39 10.65 15.83 733 0.39 12.13 17.80 541 0.29 5.03 8.86 383 0.21 3797.47 5.52 387 0.21 1859.50 4.04 394 0.21 5271.57 5.56 383 0.21 3581.55 5.56 397 0.21 1689.58 4.07 462 0.25 5477.21 5.58 572 0.31 3662.97 5.58 591 0.32 1814.23 4.25 300 0.16 1059.16 2.34 254 0.14 188.04 0.79 278 0.15 1246.45 1.14 283 0.15 753.14 1.45 255 0.14 129.54 0.49 408 0.22 1307.18 1.92 420 0.23 1059.04 2.27 498 0.27 248.14 1.00 448 0.24 1701.87 7.08 316 0.17 1109.71 2.45 354 0.19 2724.04 5.15 434 0.23 1644.19 7 317 0.17 1057.57 2.52 424 0.23 2791.03 5.18 596 0.32 1694.86 7.10 619 0.33 1096.17 2.53 232 0.26 5.55 6.95 339 0.38 10.43 11.00 349 0.39 12.16 12.77 225 0.25 4.75 5.85 350 0.39 11.08 11.73 354 0.39 12.90 13.57 265 0.29 5.19 6.37 98 0.24 3.74 3.40 141 0.35 8.89 6.66 149 0.37 10.13 7.34 94 0.23 2.99 2.71 163 0.40 10.56 7.82 163 0.40 11.81 8.49 110 0.27 4.28 3.83 Panel B CASH DEALS - All Options - Target Sign.t-stat 5% (#) 341 353 Sign.t-stat 5% (freq.) 0.38 0.39 E [CAV ] 11.22 12.98 tCAV 12.00 13.77 ¯ STOCK DEALS - All Options - Target Sign.t-stat 5% (#) 152 157 Sign.t-stat 5% (freq.) 0.38 0.39 E [CAV ] 9.35 10.59 tCAV 7.20 7.89 ¯ Panel C Statistics All Options - Target OTM-ATM OTM-ITM ATM-ITM Call Options - Target OTM-ATM OTM-ITM ATM-ITM Put Options - Target OTM-ATM OTM-ITM ATM-ITM Diff s.e. p-val Diff s.e. p-val Diff s.e. p-val 4403.64 2845.51 -1558.13 995.00 679.97 768.04 0.00 0.00 0.04 4414.89 2547.53 -1867.35 1001.70 625.35 870.18 0.00 0.00 0.03 4170.03 2686.17 -1483.86 965.00 644.32 803.99 0.00 0.00 0.07 2738.31 2095.60 -642.71 640.40 609.21 454.39 0.00 0.00 0.16 2828.41 1937.35 -891.06 697.69 577.47 514.97 0.00 0.00 0.08 2603.93 1968.11 -635.82 655.36 587.85 462.95 0.00 0.00 0.17 1671.46 749.79 -921.67 478.39 300.46 500.32 0.00 0.01 0.07 1560.04 632.01 -928.03 443.08 313.97 499.72 0.00 0.04 0.06 1566.10 718.06 -848.04 449.78 310.18 498.29 0.00 0.02 0.09 70
72) 71 -3.64 (2.36) 4.07*** (1.12) 3.59*** (1.26) -1.98 (2.38) -0.65 (1.62) 5.15** (2.38) 2.47* (1.48) 0.85 (2.00) -0.27 (1.52) (1) CABV OLP 1,859 0.03 YES GLS NO 0.02 Constant Observations R-squared YEAR FE SE CLUSTER adj.R2 MKTVOL ARUNUP TTPRET1 TANNRET TRUNUP ADVISORS SALES PRICE PREM1D US FRIENDLY TERM COLLAR PRIVATE TOE CASH SIZE VARIABLES 1,859 0.03 YES GLS YES 0.02 -3.64 (2.36) 4.07*** (1.12) 3.59*** (1.23) -1.98 (2.42) -0.65 (1.60) 5.15** (2.39) 2.47* (1.49) 0.85 (2.01) -0.27 (1.53) (2) CABV OLP 1,829 0.03 YES GLS NO 0.02 -5.47** (2.62) 0.84* (0.45) 3.32*** (1.23) 3.78*** (1.27) -2.05 (2.45) -0.89 (1.66) 5.36** (2.39) 2.18 (1.53) 0.89 (2.09) -0.17 (1.52) (3) CABV OLP 1,829 0.03 YES GLS YES 0.02 -5.47** (2.64) 0.84* (0.44) 3.32*** (1.22) 3.78*** (1.25) -2.05 (2.48) -0.89 (1.64) 5.36** (2.40) 2.18 (1.54) 0.89 (2.09) -0.17 (1.54) (4) CABV OLP 1,806 0.03 YES GLS NO 0.02 -3.72 (2.45) 3.91*** (1.26) -2.08 (2.43) -1.04 (1.62) 5.18** (2.40) 2.66* (1.49) 1.23 (2.04) -0.08 (1.53) -0.04*** (0.02) 0.04** (0.02) 2.73** (1.17) (5) CABV OLP 1,806 0.03 YES GLS YES 0.02 -3.72 (2.47) 3.91*** (1.23) -2.08 (2.43) -1.04 (1.60) 5.18** (2.41) 2.66* (1.48) 1.23 (2.04) -0.08 (1.55) -0.04*** (0.02) 0.04** (0.02) 2.73** (1.16) (6) CABV OLP 1,859 0.07 YES GLS NO 0.06 -2.79 (2.37) 14.18*** (2.07) -3.47 (4.30) -6.53 (4.09) -2.43 (3.50) 3.47*** (1.10) 3.78*** (1.28) -0.88 (2.29) -1.02 (1.60) 4.97** (2.32) 2.10 (1.44) 0.26 (1.99) 0.19 (1.50) (7) CABV OLP at the 1%, 5% and 10% level, respectively. Source: Thomson Reuters SDC Platinum, CRSP, OptionMetrics. ∗∗∗ , ∗∗ 1,859 0.07 YES GLS YES 0.06 -2.79 (2.38) 14.18*** (2.10) -3.47 (4.33) -6.53 (4.15) -2.43 (3.48) 3.47*** (1.10) 3.78*** (1.26) -0.88 (2.29) -1.02 (1.58) 4.97** (2.33) 2.10 (1.44) 0.26 (1.97) 0.19 (1.51) (8) CABV OLP adjusted R-squared. Standard errors are robust (GLS) and possibly clustered (CLUSTER) by announcement day. ∗ 1,859 0.07 YES GLS NO 0.06 14.27*** (2.07) -3.55 (4.30) -6.48 (4.09) -2.34 (3.51) -0.91 (1.55) 1.00 (6.84) 3.46*** (1.10) 3.74*** (1.28) -0.86 (2.29) -1.03 (1.60) 4.96** (2.32) 2.08 (1.44) 0.23 (1.99) 0.19 (1.50) 1,859 0.07 YES GLS YES 0.06 14.27*** (2.10) -3.55 (4.33) -6.48 (4.15) -2.34 (3.51) -0.91 (1.58) 1.00 (6.98) 3.46*** (1.10) 3.74*** (1.26) -0.86 (2.29) -1.03 (1.58) 4.96** (2.33) 2.08 (1.44) 0.23 (1.97) 0.19 (1.51) (10) CABV OLP denote statistical signiï¬cance (9) CABV OLP and the announcement day. Each regression contains year ï¬xed effects (YEAR FE). We report the number of observations (Observations), the R-squared and the return, and ARU N U P is the abnormal stock return for the acquirer before the announcement day. M KT V OL denotes the market volume on the day before return for the target, T AN N RET denotes the target’s announcement abnormal return, T T P RET 1 is the target’s post-announcement cumulative abnormal months. The total number of target and acquirer advisors is given by ADV ISORS. T RU N U P denotes the pre-announcement cumulative abnormal stock as a percentage. P RICE denotes the price per common share paid by the acquirer in the transaction. SALES is the target’s net sales over the previous 12 and zero otherwise. P REM 1D refers to the premium of offer price to target closing stock price one day prior to the original announcement date, expressed takeover negotiations fail, F RIEN DLY has the value one if the deal attitude is considered to be friendly, and U S is one if the bidder is a US-based company post-acquisition, COLLAR takes the value one for transactions with a collar structure, T ERM is one for deals that have a termination fee that applies if the zero otherwise, T OE has the value one if a bidder already has a toehold in the target company, P RIV AT E equals one if the acquirer privatizes the target the event window. SIZE quantiï¬es the M&A deal value. CASH is a categorical value taking the value one if the deal is a cash-ï¬nanced takeover and set of M&A characteristics and market activity measures. Log cumulative abnormal volume is standardized by the average normal options volume during Table A.3 reports generalized least squares (GLS) regression results from the projection of cumulative abnormal put option log volume (CABV OLP ) on a Table A.3: Cumulative Abnormal Volume Regressions - Put Options With Scaled Volume
73) Table A.4: List of SEC Litigated Cases Table A.4 summarizes the information about unusual options trades ahead of M&A announcements that are litigated by the Securities and Exchange Commission (SEC). All information is hand collected from the SEC litigation reports, which are publicly available on the SEC’s web site. We only summarize cases that involve option trades and M&A announcements. A ∗ in front of the ï¬rst column indicates that the M&A is a cash-ï¬nanced deal. If the transaction is stock-ï¬nanced, the ï¬rst column is preceded by a # sign. In addition, the numbers preceding the ï¬rst column indicate whether the insider trading involved only options (1), or both options and stocks (2). Acquirer and Target indicate, respectively, the acquirer’s and target’s company name. The column Ann.Date indicates the date of the M&A announcement as reported by the Thomson Reuters SDC Platinum database. The remaining pieces of information in the table are the ï¬nal takeover/merger price (Offer Pr.), the deal value in the transaction (Deal Val.), the stock price on the day of the options trade (Stock Pr.), the option purchase date (Op. Date), the number of option contracts (Options), the expiration month of the option (Exp.), the strike price of the option (Strike), the option depth, deï¬ned as the ratio of the stock price to the strike price (S/K ), the option type, which can be either a call or a put (Type), the total value of illicit proï¬ts reaped through the insider trade (Tot. Illicit Prof.), and the monetary ï¬ne imposed in the litigation (Fine). Source: https://www.sec.gov/litigation/litreleases.shtml. Target Ann.Date Offer Pr. Deal Val. Stock Pr. Op. Date Options Exp. Strike S/K Type ∗1 72 Acquirer Amgen Onyx Pharmaceuticals 06/30/13 $120.00 $9,700,000,000 ∗2 Shuanghui Smithï¬eld Foods 05/29/13 $34.00 $4,700,000,000 Berkshire Hath. 3G Capital Partners 2 Chicago Bridge ∗1 Bristol-MyersSquibb H.J.Heinz Company 02/14/13 $72.50 $28,000,000,000 $84.17 $84.17 $85.20 $86.82 $86.82 $25.79 $25.97 $60.48 06/26/13 06/26/13 06/27/13 06/28/13 06/28/13 05/21/13 05/28/13 02/13/13 80 175 544 50 270 1,300 1,700 2,533 Jul Jul Jul Jul Jul Jul Jul Jun $80.00 $85.00 $85.00 $90.00 $92.50 $29.00 $29.00 $65.00 $1.05 $0.99 $1.00 $0.96 $0.94 $0.89 $0.90 $0.93 C C C C C C C C The Shaw Group Amylin Pharmaceuticals 07/30/12 06/29/12 $46.00 $31.00 $3,000,000,000 $5,300,000,000 $0.89 $1.23 $1.29 $1.28 $1.24 $1.11 $0.93 $1.00 $0.97 Zhongpin Paciï¬c Capital Pharmasset 03/27/12 03/09/12 11/21/11 $13.50 $46.00 $137.00 $503,000,000 $1,500,000,000 $11,000,000,000 1 Complete Product Services K-Sea Transportation Partners 10/10/11 $32.90 $2,700,000,000 03/13/11 $8.15 $604,000,000 2,303 100 100 100 200 210 30 50 50 7,338 120 10 19 10 20 33,000 3,500 205 2 100 200 94 $29.00 $21.00 $20.00 $22.00 $22.00 $25.00 $30.00 $28.00 $29.00 Zhongpin’s Mgmt UnionBanCal ∗1 Gilead Sciences 07/26/12 05/24/12 05/24/12 05/29/12 06/11/12 06/18/12 06/26/12 06/27/12 06/29/12 03/14/12 02/08/12 11/08/11 11/08/11 11/17/11 11/17/11 09/29/11 09/29/11 03/12/11 03/12/11 11/01/10 02/11/11 02/14/11 Aug Jul Jul Jul Jul Jul Jul Jul Jul ∗2 $25.89 $25.80 $25.80 $28.21 $27.33 $27.81 $27.90 $28.04 $28.20 $8.36 $28.99 $69.07 $69.07 $72.83 $72.83 $20.51 $20.51 $4.03 $4.03 $4.03 $5.33 $5.64 C P P P P P C C C C C C C C C C C C C C C C ∗1 ∗2 Superior Energy Services 2 Kirby Corporation Dec Feb Dec Dec Oct Nov Sep Jun Mar Sep Jun $85.00 $100.00 $90.00 $100.00 $25.00 $22.50 $0.81 $0.69 $0.81 $0.73 $0.82 $0.91 Tot. Illicit Prof. $4,600,000 Fine Unresolved $3,200,000 Unresolved $1,800,000 $500,000 $7,145,000 $55,784 Unresolved $324,422 $9,200,000 $365,000 $225,026 Unknown Ongoing $324,777 $27,800 Ongoing $1,869,000 Unknown Continued on next page
74) Table A.4 – Continued from previous page Deal Val. Stock Pr. Op. Date Options Acquirer Target Ann.Date Offer Pr. 2 Smurï¬t-Stone Container Corp. Martek King Pharma. AirTran ZymoGenetics 01/23/11 $35.00 $3,500,000,000 $27.90 01/19/11 12/21/10 10/12/10 09/27/10 09/07/10 $31.50 $14.25 $7.69 $9.75 $1,100,000,000 $3,566,079,000 $1,400,000,000 $885,000,000 Burger King 09/02/10 $24.00 $4,000,000,000 $22.49 $10.20 $4.39 $5.04 $5.51 $20.07 $19.85 $19.36 $16.72 $17.51 $17.05 $112.04 $112.04 $112.04 $112.04 $112.04 $111.34 $111.34 $110.57 $110.57 $110.57 $110.57 $112.04 $13.82 $17.75 $17.75 $18.67 $18.67 $18.72 $18.90 $11.87 $11.69 $11.45 $31.42 12/10/10 08/18/10 09/22/10 08/25/10 09/03/10 05/17/10 05/18/10 06/02/10 08/19/10 08/25/10 08/26/10 08/12/10 08/12/10 08/12/10 08/12/10 08/12/10 08/13/10 08/13/10 08/16/10 08/16/10 08/16/10 08/16/10 08/12/10 03/26/10 06/10/10 06/10/10 06/11/10 06/11/10 06/14/10 06/15/10 03/17/10 03/25/10 03/29/10 01/14/10 2,615 300 200 45 35 300 2,850 2,000 1,400 100 1,794 31 50 95 22 32 5 12 50 5 5 5 331 $31.42 $12.74 $67.80 $68.69 $41.49 $41.49 $16.66 01/14/10 01/14/10 12/07/09 12/17/09 12/11/09 12/11/09 09/04/09 $13.26 $13.26 $39.01 $38.73 $37.76 05/01/09 05/01/09 08/13/09 08/14/09 08/17/09 Rock-Tenn Co. ∗1 DSM N.V. Pï¬zer 2 Southwest Airlines ∗1 Bristol-MyersSquibb ∗2 3G Capital ∗2 BHP Billiton Potash Corp. 08/17/10 $130.00 $38,600,000,000 ∗2 GENCO Dist. Sys. Covidien ATC Technology Somanetics 07/19/10 06/16/10 $25.00 $25.00 $512,600,000 $250,000,000 ∗2 Cerberus Capital Management DynCorp 04/12/10 $17.55 $1,500,000,000 2 Brinks Home Security 01/18/10 $42.50 $2,000,000,000 Shiseido ∗1 Sanoï¬-Aventis Bare Escentuals Chattem 01/14/10 12/21/09 $18.20 $93.50 $1,700,000,000 $1,900,000,000 #2 XTO Energy 12/14/09 $51.86 $30,000,000,000 Perot Systems 09/21/09 $30.00 $3,900,000,000 Sepracor 09/03/09 $23.00 $2,600,000,000 Marvel Entertainment 08/31/09 $50.00 $4,000,000,000 73 ∗1 ∗2 Tyco International ∗2 ∗2 2 Exxon Mobil Dell Dainippon Sumitomo Pharna 1 Company Walt Disney Exp. Strike S/K Type C $27.00 $0.83 Jan Oct Feb Jul Jul Jul Oct Jan Oct Aug Aug Aug Aug Aug Aug Aug Aug Sep Sep Sep Sep $5.00 $5.00 $20.00 $22.50 $20.00 $17.50 $20.00 $19.00 $110.00 $115.00 $120.00 $125.00 $130.00 $115.00 $120.00 $110.00 $110.00 $115.00 $120.00 $125.00 $1.01 $1.10 $1.00 $0.88 $0.97 $0.96 $0.88 $0.90 $1.02 $0.97 $0.93 $0.90 $0.86 $0.97 $0.93 $1.01 $1.01 $0.96 $0.92 $0.90 72 200 110 473 288 19 10 30 30 100 Jun Jun Jun Jun Jun Jun Apr Apr May Feb $17.50 $20.00 $17.50 $20.00 $20.00 $20.00 $12.50 $12.50 $12.50 $35.00 $1.01 $0.89 $1.07 $0.93 $0.94 $0.95 $0.95 $0.94 $0.92 $0.90 30 280 1,900 940 200 1,000 9,332 Jun $30.00 $1.05 Jan Jan Dec Dec Oct $75.00 $80.00 $40.00 $45.00 $0.90 $0.86 $1.04 $0.92 125 2 60 Sep Sep Sep $50.00 $45.00 $45.00 $0.78 $0.86 $0.84 C C C C C C C C C C C C C C C C C C C C C C C C C C C C C C C C C C C C C C C C C C P C C C Tot. Illicit Prof. $1,488,000 Fine Unknown $1,200,000 $300,000 $159,160 $30,551 $1,445,700 Ongoing $327,707 $324,777 $1,680,000 $5,634,232 $1,073,000 Unknown $748,021 $547,000 Unknown Pending $29,800 Ongoing $88,555 $137,120 $157,066 $300,000 $42,000,000 $3,776 $573,516 $681,182 $8,600,000 $8,600,000 $904,000 $1,000,000 $192,000 Ongoing Continued on next page
75) Acquirer ∗2 IBM Target Ann.Date Offer Pr. Table A.4 – Continued from previous page Deal Val. Stock Pr. Op. Date Options 07/28/09 $50.00 $1,200,000,000 The Middleby Corporation TurboChef Technologies 08/12/08 $6.47 $200,000,000 ∗2 Dow Rohm & Hass 07/10/08 $78.00 $16,300,000,000 ∗1 Finmeccanica DRS 05/08/08 $81.00 $5,200,000,000 Liberty Mutua Insurance Safeco Corp. 04/23/08 $68.50 $6,200,000,000.00 ∗2 Millennium Pharmaceuticals 04/10/08 $25.00 $8,800,000,000 74 SPSS 2 ∗2 Takeda Pharma. $38.65 $38.65 $32.71 $32.71 $32.71 $33.20 $32.73 $32.73 $32.54 $32.54 $30.70 $30.92 $30.92 $31.03 $31.63 $31.73 $31.73 $34.09 $34.09 $34.38 $34.38 $34.38 $34.38 $34.38 $35.10 $35.09 $4.62 $4.29 $4.29 $4.60 $5.25 $5.25 $5.26 $78.94 $78.94 $61.70 $64.72 $63.07 $63.74 $45.00 $46.17 $46.17 $46.17 $46.49 $45.61 $45.23 $45.23 $45.23 $13.75 $13.75 08/28/09 08/28/09 06/25/09 06/25/09 06/25/09 06/26/09 07/02/09 07/02/09 07/06/09 07/06/09 07/08/09 07/09/09 07/09/09 07/10/09 07/13/09 07/14/09 07/14/09 07/21/09 07/21/09 07/22/09 07/22/09 07/22/09 07/22/09 07/22/09 07/24/09 07/27/09 07/01/08 07/10/08 07/10/08 07/22/08 07/30/08 07/30/08 08/01/08 07/09/08 07/09/08 04/29/08 05/05/08 05/06/08 05/07/08 04/15/08 04/17/08 04/17/08 04/17/08 04/18/08 04/21/08 04/22/08 04/22/08 04/22/08 03/04/08 03/04/08 460 12 50 20 20 20 25 25 50 75 100 25 75 25 50 25 50 20 10 29 50 100 30 100 20 100 200 100 100 200 500 300 200 200 210 550 170 170 930 22 105 50 3 250 20 50 5 100 100 100 Exp. Strike S/K Type Sep Sep Sep Jul Jul Jul Sep Aug Sep Sep Sep Sep Sep Sep Sep Sep Sep Sep Sep Sep Sep Aug Aug Sep Sep Aug Jan Oct Jan Aug Aug Oct Aug Aug Jan Jun Jun Jun Jun Apr May May May May May May May May Apr May $45.00 $40.00 $40.00 $35.00 $35.00 $35.00 $40.00 $40.00 $40.00 $40.00 $35.00 $35.00 $40.00 $35.00 $40.00 $35.00 $40.00 $40.00 $40.00 $35.00 $40.00 $40.00 $40.00 $40.00 $40.00 $40.00 $0.86 $0.97 $0.82 $0.93 $0.93 $0.95 $0.82 $0.82 $0.81 $0.81 $0.88 $0.88 $0.77 $0.89 $0.79 $0.91 $0.79 $0.85 $0.85 $0.98 $0.86 $0.86 $0.86 $0.86 $0.88 $0.88 $5.00 $5.00 $5.00 $0.86 $0.86 $0.92 $50.00 $50.00 $65.00 $70.00 $70.00 $65.00 $50.00 $55.00 $50.00 $55.00 $50.00 $50.00 $50.00 $45.00 $50.00 $15.00 $17.50 $1.58 $1.58 $0.95 $0.92 $0.90 $0.98 $0.90 $0.84 $0.92 $0.84 $0.93 $0.91 $0.90 $1.01 $0.90 $0.92 $0.79 C C C C C C C C C C C C C C C C C C C C C C C C C C C C C C C C C C C C C C C C C C C C C C C C C C Tot. Illicit Prof. Fine $237,644 $485,988 $68,000 Unknown $1,015,069 $934,220 $967,699 $3,000,000 $886,078 $392,762 $42,000 $1,414,290 Continued on next page
76) Acquirer ∗2 STMicroelectronics ∗1 2 Vivendi S.A. VestarCapital Target Ann.Date Offer Pr. Table A.4 – Continued from previous page Deal Val. Stock Pr. Op. Date Options S/K Type Apr May May $17.50 $17.50 $15.00 $0.77 $0.75 $0.89 C C C C C C C 12/11/07 $8.65 $336,000,000 Activision, Inc. Radiation Therapy Services, Inc. 12/02/07 10/19/07 $27.50 $32.50 $1,700,000,000 $764,000,000 $13.40 $13.08 $13.32 $5.73 $5.40 $21.54 $22.10 03/05/08 03/07/08 03/11/08 11/14/07 12/10/07 11/27/07 10/09/07 100 250 100 30 70 26 4 10/15/07 3 $12.00 $285,000,000 $6.61 07/02/07 07/03/07 $47.50 $26,000,000,000 Roche Holdings Silver Lake Partners & TPG LLP ∗1 Warburg Pincus 2 Alcoa ∗2 Eurex Frankfurt Ventana Avaya 06/25/07 06/04/07 $75.00 $17.50 $3,665,414,000 $8,200,000,000 Bausch & Lomb Alcan International Securities Exchange Holdings 05/16/07 05/07/07 04/30/07 $65.00 $73.25 $67.50 $4,500,000,000 $33,000,000,000 $2,800,000,000 ∗2 MedImmune (MEDI) 04/23/07 $58.00 $15,600,000,000 $33.87 $36.05 $36.05 $53.08 $16.72 $16.72 $48.56 $57.93 $46.24 $46.92 $45.72 $45.72 $45.72 $45.72 $32.44 $33.04 $32.66 $34.04 $34.04 $34.98 $34.98 $35.72 $35.72 $36.39 $36.13 $35.44 $35.44 $35.44 $36.76 $36.76 $36.76 $37.07 $37.84 $44.19 $44.19 $45.44 $45.44 07/02/07 07/03/07 07/03/07 06/15/07 06/04/07 06/04/07 09/05/06 05/01/07 12/26/06 12/28/06 04/27/07 04/27/07 04/27/07 04/27/07 03/15/07 03/19/07 03/20/07 03/21/07 03/21/07 03/28/07 03/28/07 03/29/07 03/29/07 03/30/07 04/03/07 04/04/07 04/04/07 04/04/07 04/09/07 04/09/07 04/09/07 04/10/07 04/11/07 04/13/07 04/13/07 04/16/07 04/16/07 550 100 1,283 20 305 125 80 240 100 200 300 100 300 92 500 300 800 250 24 1,515 200 1,500 500 500 247 7 250 250 450 250 500 99 250 1,565 1,100 2,000 10 Feb 20 ∗2 ∗2 75 AstraZeneca Fine $51,206 $152,475 $9,725 $16,200 $21,239 $1,246,077 C 07/31/07 Blackstone Group Tot. Illicit Prof. C Cambridge Display Technology Hilton Hotels Corp. 2 Sumitomo Strike $22.70 Genesis Microchip Partners, L.P ∗2 Exp. Aug Jul $35.00 $35.00 $0.97 $1.03 Sep $30.00 $1.62 Feb Feb May Jun Jun Jul Apr May May May Jun Jun May Jun May May Apr Jun May Apr May Apr Apr Apr Apr May May May May $50.00 $50.00 $55.00 $55.00 $60.00 $60.00 $32.50 $35.00 $35.00 $35.00 $40.00 $40.00 $40.00 $40.00 $40.00 $40.00 $40.00 $40.00 $40.00 $35.00 $40.00 $37.50 $40.00 $40.00 $40.00 $50.00 $47.50 $50.00 $47.50 $0.92 $0.94 $0.83 $0.83 $0.76 $0.76 $1.00 $0.94 $0.93 $0.97 $0.85 $0.87 $0.87 $0.89 $0.89 $0.91 $0.90 $0.89 $0.89 $1.01 $0.92 $0.98 $0.92 $0.93 $0.95 $0.88 $0.93 $0.91 $0.96 C C C C C C C C C C C C C C C C C C C C C C C C C C C C C C C C C C C C C $156,702 $6,393,000 $461,660 $220,725 $170,000 $597,770 $1,100,000 Unknown $14,000,000.00 $16,645,027 Continued on next page
77) Acquirer 2 Hellman & Friedman ∗2 KKR, TPG, Goldman Target Ann.Date Offer Pr. Table A.4 – Continued from previous page Deal Val. Stock Pr. Op. Date Options Kronos 03/22/07 $55.00 $1,793,086,000 TXU Corp 02/26/07 $69.25 $45,000,000,000 ∗2 MDS Molecular Devices 01/29/07 $34.50 $615,000,000 ∗1 Schneider Electric American Power Conversion Corp. CNS Inc 10/30/06 $31.00 $6,100,000,000 10/09/06 $37.50 $566,000,000 1 GlaxoSmithKline 2 PNC Financial Carlyle, Permira Funds, Texas Paciï¬c ∗2 Green Equity Investors ∗2 Tenaris SA (ADR) Mercantile Freescale Semiconductor Petco Animal Supplies Maverick Tube 10/09/06 09/14/06 $47.24 $40.00 $5,981,802,000 $17,600,000,000 07/14/06 $29.00 $1,800,000,000 06/12/06 $65.00 $2,600,000,000 ∗2 Aviall Andrx Corp Albertson’s, LLC 05/01/06 03/13/06 01/23/06 $48.00 $25.00 $26.29 $1,700,000,000 $1,900,000,000 $17,543,845,000 Abgenix Georgia-Paciï¬c Placer Dome ID Biomedical Corp 12/14/05 11/14/05 10/31/05 09/07/05 $22.50 $48.00 $20.50 $28.82 $2,200,000,000 $13,200,000,000 $9,200,000,000 $1,400,000,000 ∗1 76 Boeing Watson Pharma. 2 Cerberus Supervalue CVS ∗2 Amgen ∗2 Koch Industries 1 Barrick Gold Corp. ∗2 GlaxoSmithKline ∗2 Exp. Strike S/K Type $50.00 $47.50 $47.50 $40.00 $0.90 $0.95 $1.01 $1.17 C C C C $45.09 $45.09 $48.01 $46.63 04/17/07 04/17/07 04/20/07 03/16/07 815 500 2,300 35 May May Apr Apr $56.47 $56.76 $57.01 $56.07 $56.07 $56.07 $60.02 $60.02 $23.11 $23.11 $21.30 $21.40 $32.01 $32.36 $32.36 $32.62 $40.13 $31.39 02/06/07 02/13/07 02/20/07 02/21/07 02/21/07 02/21/07 02/23/07 02/23/07 01/22/07 01/22/07 09/21/06 09/22/06 09/28/06 09/29/06 09/29/06 10/02/06 10/06/06 09/05/06 130 300 400 560 40 220 3,500 3,200 5 10 1,600 800 270 136 45 655 20 243 Feb Mar Apr Mar Mar Apr Mar Mar Feb Mar Dec Dec Nov Nov Nov Oct $60.00 $60.00 $62.50 $57.50 $60.00 $22.50 $25.00 $22.50 $22.50 $30.00 $30.00 $30.00 $30.00 $0.93 $0.93 $0.90 $1.04 $1.00 $1.03 $0.92 $0.95 $0.95 $1.07 $1.08 $1.08 $1.09 Sep $35.00 $0.90 $19.80 $19.45 $49.19 $49.19 $49.98 $49.98 $47.64 $47.64 $47.98 $47.98 $46.49 $46.49 $47.58 $47.58 $37.70 $17.87 $22.72 $23.02 $23.61 $14.10 $33.89 $16.45 $20.46 $20.90 $20.41 06/28/06 07/13/06 06/01/06 06/01/06 06/02/06 06/02/06 06/05/06 06/05/06 06/06/06 06/06/06 06/07/06 06/07/06 06/09/06 06/09/06 04/28/06 02/24/06 01/12/06 01/17/06 01/18/06 12/01/05 11/10/05 10/25/05 07/29/05 08/03/05 08/04/05 665 185 100 100 100 20 140 40 100 20 200 40 50 25 Jul Aug Jun Jun Jun Jun Jun Jun Jun Jun Jun Jun Jun Jun $22.50 $20.00 $50.00 $55.00 $55.00 $50.00 $55.00 $55.00 $55.00 $55.00 $55.00 $55.00 $55.00 $55.00 $0.88 $0.97 $0.98 $0.89 $0.91 $1.00 $0.87 $0.87 $0.87 $0.87 $0.85 $0.85 $0.87 $0.87 425 25 15 155 241 5,000 629 71 49 Nov Aug Sep Sep $20.00 $20.00 $20.00 $1.02 $1.04 $1.02 C C C C C C C C C C C C C C C C C C C C C C C C C C C C C C C C C C C C C C C C C C C Tot. Illicit Prof. Fine $315,000 Unknown $30,200 $1,440,850 $3,000,000 $499,696 $374,655 $98,390 $22,910 $202,589 $465,325 ongoing $1,100,000 ongoing $792,413 Unknown $95,807 $191,614 $275,390 $689,401 $1,900,000 $9,721 Ongoing $1,246,077 Continued on next page
78) Table A.4 – Continued from previous page Deal Val. Stock Pr. Op. Date Options Acquirer Target Ann.Date Offer Pr. ∗2 Reebok Int. Guilford Pharmaceuticals Electronics Boutique Magnum Hunter Resources Charter One Fin. InVision 08/03/05 07/21/05 $59.00 $3.75 $11,800,000,000 $177,500,000 04/18/05 $55.18 01/26/05 Bank of America DHL Worldwide Express 2 Strike S/K Type Sep $20.00 $0.97 Sep Sep May $2.50 $2.50 $47.50 $0.90 $0.95 $0.91 C C C C C $1,440,000,000 $19.31 42.76 $2.25 $2.37 $43.10 8/8/2005 08/01/05 07/13/05 07/15/05 04/12/05 $16.84 $1,500,000,000 $12.90 12/31/04 05/04/04 03/15/04 $44.50 $50.00 $10,529,984,000 $900,000,000 FleetBoston Fin. Airborne Express 10/27/03 03/24/03 $45.00 $21.50 $47,000,000,000 $1,050,000,000 $0.90 $0.90 $0.91 $40.40 $46.00 $5,882,760,000 $23,000,000,000 2,500 1,965 1,100 860 80 50 130 100 170 480 250 526 250 $45.00 $45.00 $35.00 05/21/02 04/03/01 05/04/04 03/06/04 03/06/04 10/24/03 02/28/03 03/05/03 03/06/03 03/10/03 03/11/03 03/24/03 03/10/02 04/03/01 04/03/01 04/03/01 Mar Apr Nov Golden State Banc. American General Corporation Ralston Purina Acuson Corporation $34.45 $40.54 $40.54 $31.80 $14.04 $13.60 $13.54 $13.11 $13.02 $18.05 $30.02 $36.80 $36.80 $36.80 Apr Apr May $37.50 $40.00 $37.50 $0.98 $0.92 $0.98 01/16/01 09/27/00 $33.50 $23.00 $10,000,000,000 $700,000,000 $14.63 09/21/00 200 Oct $15.00 $0.98 Cobalt Networks Associates First Capital Corp. 09/18/00 09/06/00 $57.63 $42.22 $2,000,000,000 $31,100,000,000 $41.13 $27.81 09/18/00 09/05/00 20 Telus Corporation ∗2 NCR Corporation ∗2 ING Clearnet Comm. 4Front Technol. ReliaStar 08/21/00 08/03/00 05/01/00 $47.50 $18.50 $54.00 $3,100,000,000 $250,000,000 $6,100,000,000 ∗1 Travelers Property Casualty Corp Mobil Arterial Vascular Engineering 03/21/00 $25.00 $2,400,000,000 $38.63 $30.44 $17.81 $30.81 $30.81 $30.81 $43.00 $40.94 09/06/00 08/17/00 07/17/00 04/27/00 04/27/00 04/27/00 04/28/00 03/21/00 30 20 460 410 36 50 79 15 12/01/98 11/30/98 $99.01 $54.00 $82,000,000,000 $3,700,000,000 Teledata Commun. USCS International Hercules Neurex Corp. Mid Ocean Ltd Mapco Inc. Barnett Banks 09/16/98 09/02/98 07/30/98 04/29/98 03/16/98 11/24/97 08/29/97 $15.75 $35.19 $72.00 $32.70 $75.00 $46.00 $75.18 $200,000,000 $874,000,000 $3,100,000,000 $700,000,000 $2,100,000,000 $2,650,000,000 $15,500,000,000 $73.50 $30.69 $31.19 $30.69 $9.50 $26.00 $67.69 $20.13 $63.31 $34.38 $52.31 11/19/98 11/19/98 11/25/98 11/19/98 09/01/98 09/02/98 07/30/98 04/27/98 03/13/98 11/20/97 08/26/97 08/26/97 100 250 800 235 225 200 100 2 Adidas-Salomon MGI Pharma 1 GameStop #2 ∗1 ∗1 Cimarex Energy Citizens Bank GE #1 2 Citibank American International Group ∗2 Nestl´ S.A. e ∗1 Siemens Medical Engineering Group #2 Sun Microsystems #1 Citigroup 2 77 2 Citigroup #1 ∗2 Exxon Corp. Medtronic ∗2 ADC Telecomm. DST Systems ∗2 BetzDearborn #2 Elan Corporation #2 Exel Ltd #1 Williams Co. #2 Nations Bank #2 33 4,157 150 48 400 Exp. Tot. Illicit Prof. Ongoing $308,000 C C Sep Aug May Jul May May $30.00 $12.50 $35.00 $35.00 $30.00 $30.00 $1.01 $1.43 $0.88 $0.88 $1.03 $1.43 Dec Mar 280 80 C C C C C C C C C C C C C C C C $65.00 $0.97 C C C C C C C C C C C C C C C C C C NationsBank C Fine $785,000 $57,599 $743,505 $1,700,000 $5,963,326 $473,000 $432,742 $525,000 $1,100,000 $250,000 $61,714 $300,000 $137,486 Ongoing $292,325 $411,697 $62,437 $536,758 $65,812 $159,194 $127,288 $120,000 $265,644 $7,875 $8,574 $70,000 $1,440,131 $144,000 $4,000,000 $300,000 $70,000 $271,766 $83,663 $141,559 $134,209 $214,000 Unknown Unknown Unknown $175,529 $450,000 $106,341 Unknown Continued on next page
79) Acquirer Target Ann.Date Offer Pr. #1 VeriFone APL Ltd 04/23/97 04/13/97 $50.50 $33.50 Hewlett-Packard Neptune Orient Lines ∗1 ∗1 ∗2 $15.75 $21.50 $21.50 $21.50 $21.50 $46.13 $48.13 $49.13 04/21/97 04/11/97 04/11/97 04/11/97 04/11/97 10/24/96 09/10/96 09/11/96 400 400 340 550 65 1,100 600 $32.50 $16.25 $19.00 $19.13 $18.75 $17.25 06/02/95 12/15/94 12/19/94 12/20/94 01/06/95 02/17/95 10/28/96 09/12/96 $56.00 $58.87 $1,289,056,000 $7,000,000,000 IBM Luxottica S.p.A. Lotus Development U.S. Shoe Corp 06/05/95 03/03/95 $64.00 $24.00 $3,200,000,000 $1,400,000,000 Alias Research, Inc. Caesars World MEDSTAT Group Intuit, Inc. Lockheed Intergroup Healthcare Corp. Medco Containment Services Inc. Rochester Community Savings Bank NCR Corporation 02/07/95 12/19/94 11/16/94 10/13/94 08/29/94 07/28/94 $28.13 $67.50 $27.00 $76.49 $78.65 $65.00 $124,400,000.00 $1,700,000,000.00 $339,000,000 $1,500,000,000 $10,000,000,000 $720,000,000.00 $45.25 $17.25 $47.00 $63.25 $20.50 12/16/94 11/16/94 10/13/94 08/22/94 07/18/94 07/28/93 $39.00 $6,000,000,000 $29.00 07/23/93 $12.50 04/01/93 Silicon Graphics ITT Corp. ∗2 Thomson Corp. #2 Microsoft #1 Martin Marietta #2 Foundation Health 2 Merck ∗1 78 Sovereign Bancorp #1 AT&T 05/05/93 12/02/90 $110.00 $7,400,000,000 Exp. Strike S/K Type $1.08 $0.96 $0.92 $0.96 $0.89 C C C C C C C 15 10 10,000 36 870 Loctite Corp Duracell International #2 2 $1,180,000,000 $825,000,000 Henkel KGaA The Gillette #1 ∗2 Table A.4 – Continued from previous page Deal Val. Stock Pr. Op. Date Options May Jul May May Dec Sep Sep $20.00 $22.50 $50.00 $50.00 $55.00 Tot. Illicit Prof. $209,281 Fine Unknown Unknown $55,000 $1,000,000 Unknown $1,770,000 $467,990 624787.68 $330,000 $1,000,000 C C C C C, P $38,561 $50,306 $167,933 $202,803 $177,236 $109,003 $123,716 Pending $404,953 $472,342 75 C $122,623 $60,474 60 C $52,562 Unknown $350,000 Unknown C C C C C 34 40 Jan $50.00 $0.91 189 Sep $70.00 $0.90 $218,006
80) Figure A.1: Option-to-Stock Trading Volumes Figure A.1 plots distributional statistics of the option trading volume, deï¬ned as the number of traded contracts, and stock trading volume, deï¬ned as the number of traded shares, over event-day windows from 30 days before until the day of the announcement. On each graph, we report the average, the median, the 90th percentile and either the distribution (below the 95th percentile) or the interquartile range. Figures (A.1a) and (A.1b) plot the call-to-stock volume ratio. Figures (A.1c) and (A.1d) plot the put-to-stock volume ratio. Figures (A.1e) and (A.1f) plot the call-to-put volume ratio. The left column (Figures (A.1a), (A.1c) and (A.1e)) correspond to the ratios for the target ï¬rms. The right column (Figures (A.1b), (A.1d) and (A.1f)) corresponds to the ratios for the acquirer ï¬rms. Source: OptionMetrics. (a) (b) .16 .15 .2 .16 .04 .1 .03 .02 .02 .02 .14 .03 .02 .02 .01 0 [-30;-26][-25;-21][-20;-16][-15;-11] [-10;-6] [-5;-4] Event Windows Distribution<95th pctile (axis 1) Average (axis 2) [-3;-2] [-1] .2 .08 .16 .16 .07 .03 .03 .03 .03 [0] .17 .07 .15 .03 .03 .03 90th pctile (axis 1) Median (axis 2) Distribution<95th pctile (axis 1) Average (axis 2) [-3;-2] [-1] [0] 90th pctile (axis 1) Median (axis 2) (d) .06 .07 .07 .06 .05 .03 .03 .03 .03 .03 .03 .03 .03 .02 0 0 0 0 0 0 [-30;-26] [-25;-21] [-20;-16] [-15;-11] [-10;-6] [-5;-4] Event Windows Distribution<95th pctile Average .15 .1 .1 .1 .04 .04 .04 .04 .01 [-1] [0] .01 90th pctile Median .01 20.64 12.4 13.29 13.04 10.68 2.35 [0] 2.64 2.78 3.58 3.28 8.63 Interquartile Range Median [-1] Average 90th pctile 8.35 7.45 6.3 6.64 5.84 6.14 5.35 4.34 1.8 1.88 1.82 1.83 1.86 1.87 1.74 3.37 79 [-30;-26][-25;-21][-20;-16][-15;-11] [-10;-6] [-5;-4] [-3;-2] Event Windows 11 10.19 [0] 10 1.81 0 2.18 0 2.11 [-1] 9.68 9.57 1.93 2 .02 [-3;-2] 11.35 10.2 5 Call-Put Volume Ratio 10 11.97 .04 .01 90th pctile Median 11 10.27 10 30 20 25.5 21.11 13.91 10.85 .04 .01 Call-Put Volume Ratio - Acquirer 10.9 16.83 10.87 .01 (f) 25.55 12.11 .04 Distribution<95th pctile Average 30.72 18.75 .1 [-30;-26] [-25;-21] [-20;-16] [-15;-11] [-10;-6] [-5;-4] Event Windows Call-Put Volume Ratio 18.2 .11 .1 .02 .01 (e) 19.93 .1 .05 .04 .01 0 [-3;-2] .1 0 0 .11 .1 .05 .06 .07 Put-Stock Volume Ratio .1 .2 .15 Put-Stock Volume Ratio - Acquirer .08 .07 .05 Put-Stock Volume Ratio .15 [-30;-26][-25;-21][-20;-16][-15;-11] [-10;-6] [-5;-4] Event Windows Put-Stock Volume Ratio 0 .17 .04 .03 (c) Call-Put Volume Ratio .08 .16 .02 .2 .06 .22 .19 .15 .24 .06 .17 .16 .07 .08 .1 .29 .07 .08 .05 .07 .09 .08 0 .3 .08 .07 Call-Stock Volume Ratio (axis 1) .05 .1 Call-Stock Volume Ratio (axis 2) .1 0 Call-Stock Volume Ratio (axis 1) .4 .11 .09 .04 .06 .08 .1 Call-Stock Volume Ratio (axis 2) Call-Stock Volume Ratio - Acquirer .25 Call-Stock Volume Ratio [-30;-26][-25;-21][-20;-16][-15;-11] [-10;-6] [-5;-4] [-3;-2] Event Windows Interquartile Range Median [-1] Average 90th pctile [0] 10
81) Figure A.2: Abnormal Trading Volumes Before Announcement Dates - LOG SCALE Figure (A.2a) plots the average abnormal natural logarithm of trading volume for, respectively, all equity options (dashed line), call options (solid line) and put options (dotted line), over the 30 days preceding the announcement date. Volume is deï¬ned as the number of option contracts. Figure (A.2b) reflects the average cumulative abnormal trading volume for all options (dashed line), call options (solid line) and put options (dotted line) over the same event period. Figures (A.2c) and (A.2d) plot the average abnormal and cumulative abnormal trading volume for call options in M&A transactions that are either cash-ï¬nanced (solid line) or stock-ï¬nanced (dashed line), over the 30 days preceding the announcement date. Source: OptionMetrics. (a) (b) Average Cumulative Abnormal Volume 0 Average Abnormal Log-Volume .5 1 Average Cumulative Abnormal Log Volume 0 5 10 15 1.5 Average Abnormal Log-Volume -30 -20 -10 0 -30 -20 Event Time All -10 0 Event Time Call Put All (c) Call Put (d) Average Cumulative Abnormal Volume 0 Average Abnormal Log Volume .5 1 Average Cumulative Abnormal Log Volume 0 5 10 15 1.5 Average Abnormal Volume -30 -20 -10 0 -30 Event Time Cash -20 -10 Event Time Stock Cash 80 Stock 0