Severity: Notice
Message: Undefined variable: content_category
Filename: user/transcript.php
Line Number: 106
Severity: Warning
Message: Invalid argument supplied for foreach()
Filename: user/transcript.php
Line Number: 106


1) The Size of the Affordable Mortgage Market: 2015-2017 Enterprise Single-Family Housing Goals July 2015
2) Market Estimates July 2015 i
3) Market Estimates July 2015 CONTENTS Page CONTENTS .................................................................................................................................... ii LIST OF FIGURES AND TABLES.............................................................................................. iii PREFACE ...................................................................................................................................... iv A. INTRODUCTION .................................................................................................................... 1 B. ECONOMIC AND MORTGAGE MARKET DATA .............................................................. 4 C. HOUSING AND MORTGAGE MARKET FORECAST .................................................... …7 D. STATISTICAL MODELS OF THE SINGLE-FAMILY HOUSING GOALS ...................... 17 E. CONCLUSIONS ..................................................................................................................... 31 APPENDIX A – Low-Income Borrowers Home Purchase Goal Model Statistics ...................... 31 APPENDIX B – Very Low-Income Borrowers Home Purchase Goal Model Statistics .............. 41 APPENDIX C – Low-Income Areas Home Purchase Subgoal Model Statistics ......................... 51 APPENDIX D – Low-Income Borrowers Refinance Goal Model Statistics ............................... 61 APPENDIX E – ALTERNATIVE HMDA DATA SPECIFICATIONS ..................................... 71 APPENDIX F – DATA SOURCES ............................................................................................. 86 ii
4) Market Estimates July 2015 FIGURES AND TABLES Page Figure 1. Low-Income Borrower Home Purchase Goal Forecast................................................. 20 Figure 2. Very Low-Income Borrower Home Purchase Goal Forecast ........................................ 23 Figure 3. Low-Income Areas Home Purchase Subgoal Forecast ................................................. 26 Figure 4. Low-Income Borrower Refinance Goal Forecast .......................................................... 30 Figure E.1 HMDA Data: 1996-2003 vs 2004-2013...................................................................... 74 Figure E.2 Low-Income Home Purchase Goal ............................................................................. 76 Figure E.3 Very Low-Income Home Purchase Goal .................................................................... 81 Figure E.4 Low-Income Areas Home Purchase Subgoal ............................................................. 81 Figure E.5 Low-Income Refinance Goal ...................................................................................... 83 Table 1. Market Estimates 2014 - 2017 .......................................................................................... 3 Table 2. Economic and Mortgage Market Outlook ........................................................................ 9 Table 3. Housing and Mortgage Market Outlook ......................................................................... 12 Table 4. Forecasts of Market Indicators by Source (Part 1) ......................................................... 14 Table 5. Forecasts of Market Indicators by Source (Part 2) ......................................................... 16 Table 6. Low-Income Borrower Home Purchase Goal Model ..................................................... 20 Table 7. Very Low-Income Borrower Home Purchase Goal Model ............................................ 22 Table 8. Low-Income Areas Home Purchase Subgoal Model ...................................................... 25 Table 9. Low-Income Borrower Refinance Goal Model .............................................................. 29 Table E.1 Low-Income Home Purchase Goal .............................................................................. 75 Table E.2 Very Low-Income Home Purchase Goal ..................................................................... 77 Table E.3 Low-Income Areas Home Purchase Subgoal ............................................................... 82 Table E.4 Low-Income Refinance Goal ....................................................................................... 82 Table E.5 Actual HMDA Market Performance and Projected Market ......................................... 85 iii
5) Market Estimates July 2015 PREFACE This Federal Housing Finance Agency (FHFA) research paper discusses the forecast models used in establishing housing goal benchmark levels for 2015 through 2017. The paper was prepared by Jay Schultz, Senior Economist, National Mortgage Database Team, Office of Chief Operating Officer. July 2015 iv
6) Market Estimates July 2015 v
7) Market Estimates July 2015 The Size of the Affordable Mortgage Market: 2015-2017 Enterprise Single-Family Housing Goals A. INTRODUCTION The Federal Housing Enterprises Financial Safety and Soundness Act of 1992 (the Safety and Soundness Act), as amended, mandates that the Federal Housing Finance Agency (FHFA) establish housing goals for Fannie Mae and Freddie Mac (the Enterprises).1 The goals for the single-family mortgage market are based on mortgages acquired by the Enterprises and include separate goals for home purchase and refinance mortgages. Only mortgages associated with 1-4 unit owner-occupied properties are counted. This paper documents the methodology used to estimate the market size for the LowIncome Borrower Home Purchase Housing Goal (share of borrowers with incomes no greater than 80 percent of the area median income (AMI)), the Very Low-Income Borrower Home Purchase Housing Goal (share of borrowers with incomes no greater than 50 percent of AMI), the Low-Income Areas Home Purchase Housing Subgoal (share of borrowers living in lowincome areas (where census tract median income is no greater than 80 percent of AMI) and of borrowers with incomes no greater than AMI living in high minority areas), and the Low-Income Borrower Refinance Housing Goal (share of borrowers with incomes no greater than 80 percent of AMI).2 The single-family housing goals are defined in terms of percentages of mortgages on owner-occupied properties, either home purchase or refinance, acquired by an Enterprise during a calendar year. For example, the low-income borrower home purchase goal is expressed as the 1 12 U.S.C. 4561(a). High minority areas are defined as census tracts where the percent minority is at least 30 percent of the population and the census tract median income is less than AMI. There is also a provision for designated disaster areas in the Low-Income Areas Home Purchase Goal. 2 1
8) Market Estimates July 2015 percentage share of the Enterprise’s total purchases of home purchase mortgages where the borrower’s income is no greater than 80 percent of AMI. Likewise, an Enterprise’s acquisitions of low-income borrower refinance mortgages are measured relative to all owner-occupied property refinance mortgages acquired by the Enterprise.3 The results of the market estimation models are provided in Table 1, and the remainder of this paper describes the process used to produce these projections. Section B describes the economic and market forecast data used to project the market size of each of the single-family mortgage housing goals. Section C presents the housing and mortgage market forecasts by government agencies and industry participants. Section D provides the four econometric time series models used to estimate affordability in the market. Finally, conclusions are provided in Section E. 3 To be eligible to count toward the housing goals, mortgages acquired must meet certain counting rules. These counting rules are set forth in 12 CFR part 1282. 2
9) Market Estimates July 2015 Table 1 Enterprise Single-Family Housing Goals Market Estimates 2014 - 2017 Low-Income Borrower Very Low-Income Borrower Low-Income Areas Low-Income Borrower Home Purchase Goal Home Purchase Goal Home Purchase Goal Refinance Goal 2004 27.2% 6.6% 16.7% 28.0% 2005 24.2% 5.7% 15.3% 26.0% 2006 24.0% 5.9% 15.8% 24.7% 2007 26.0% 6.1% 16.2% 24.2% 2008 25.3% 6.5% 14.1% 23.4% 2009 29.6% 8.8% 13.0% 20.8% Year 1 2010-11 Benchmarks 27% 8% 13% 21% 2010 2 27.2% 8.1% 12.1% 20.2% 2011 2 26.5% 8.0% 11.4% 21.5% 23% 7% 11% 20% 2012-14 Benchmarks 2012 2 26.6% 7.7% 13.5% 22.3% 2013 2 24.0% 6.3% 14.2% 24.3% 2014 2 22.0% +/- 2.0% 5.7% +/- 1.4% 14.0% +/- 0.6% 26.2% +/- 1.5% 2015 3 22.4% +/- 3.2% 5.9% +/- 2.5% 13.2% +/- 1.5% 21.8% +/- 2.7% 2016 3 22.9% +/- 4.2% 6.0% +/- 3.2% 13.6% +/- 2.8% 22.4% +/- 4.7% 2017 3 22.0% +/- 5.0% 5.7% +/- 3.8% 14.2% +/- 3.6% 22.8% +/- 6.2% 1 Historical market performance is based on historical HMDA data for first-lien, conventional, ARRA-equivalent conforming limit loans, excluding higher-cost and HOEPA loans (see Section B). 2 Historical market performance, the refinance goal market performance does not include the impact of loan modifications. 3 Estimated (95% confidence), does not include adjustment for loan modifications. 3
10) Market Estimates July 2015 B. ECONOMIC AND MORTGAGE MARKET DATA Historical monthly time series data used in the housing goals forecast models were obtained from a variety of sources. Gross Domestic Product (GDP), the unemployment rate, inflation rates, median prices for new homes, housing starts and new housing sales came from the Census Bureau, the Bureau of Economic Analysis and the Bureau of Labor Statistics.4 Constant maturity interest rates on Government notes and bonds came from the U.S. Department of the Treasury, while mortgage interest rates were provided by Freddie Mac’s Primary Mortgage Market Survey.5 Median house prices for existing homes and the Housing Affordability Index were obtained from the National Association of Realtors (NAR), and FHFA produces House Price Indices for all transactions and for home purchase loans. For 2013 and previous years, the refinance rate and FHA market share were calculated from Home Mortgage Disclosure Act (HMDA) data. 6 Preliminary refinance rates for 2014 are as reported by the Mortgage Bankers Association. Preliminary 2014 FHA market shares in the home purchase and refinance markets were derived using home sales, FHA endorsement data and the refinance rate.7 For the complete list of data sources, see Appendix F. FHFA measures the market performance for the single-family, owner-occupied property mortgage housing goals by analyzing HMDA data. HMDA data are loan level records of mortgage applications, originations and acquisitions that occurred during a calendar year and are 4 U.S. Department of Commerce and the U.S. Department of Labor. U.S. Treasury constant maturity interest rates were obtained from the Federal Reserve Bank of St. Louis’ FRED database. 6 HMDA data are made available from the Federal Financial Institutions Examination Council, http://www.ffiec.gov/hmda/default.htm. 7 HUD. FHA Production Report (May 2013 – October 2014). Prior years’ data came from the FHA Outlook Report. 5 4
11) Market Estimates July 2015 considered to be broadly representative of the mortgage market in the United States.8 The Federal Financial Institutions Examination Council (FFIEC) has made available a monthly nationwide time series from the loan level HMDA records with various attributes and specifications, including the performance of the four single-family housing goals and the one subgoal. For purposes of estimating the single-family mortgage market for goal-qualifying loans, FHFA defines the market as conventional conforming first lien, prime home purchase (or refinance) mortgages.9 The HMDA data used to produce the market affordability forecasts begin in 2004, when HMDA data began including (1) rate-spread information for high-cost loans, (2) an indicator for manufactured housing loans, and (3) an identifier for first-lien mortgages. The rate-spread and manufactured housing information help to better identify subprime and chattel loans. One of the issues with regard to HMDA data is the considerable delay in release of the database. At this time, the most current, publicly available HMDA data are for 2013. To inform the forecasted estimates with more current information, two supplemental data time series were used. Estimates of the goal-qualifying shares for the three home purchase goals and subgoal were calculated from FHFA’s Monthly Interest Rate Survey (MIRS) data through April 2015. The refinance goal time series was also extended using the combined Enterprise goal performance through April 2015. 8 Bhutta, Neil and Daniel R. Ringo “The 2013 Home Mortgage Disclosure Act Data.” Federal Reserve Bulletin, (November 2014) Vol. 100, No 6. The 2013 HMDA data covered 7,190 home lenders including the nation’s largest mortgage originators. 9 To be consistent with the conforming loan limits established in the American Recovery and Reinvestment Act (ARRA 2009), the conforming loan limit is defined as 1.15 times the Area Median House Price (from NAR), where the maximum (ceiling) must not exceed 1.75 times the original conforming limit for the given year. A loan is considered not prime (subprime) if the contract rate is 300 or more basis points above the 30-Year Treasury note yield. 5
12) Market Estimates July 2015 C. HOUSING AND MORTGAGE MARKET FORECAST On average, industry forecasters project the economy to continue to grow during the 2015 through 2017 period, with real GDP growing at rates between 2.6 and 2.8 percent in each year. Residential Fixed Investment is expected to grow by 5.6 percent in 2015, 8.6 percent in 2016 and 8.9 percent in 2017 (see Table 2). The effects of interest rates, unemployment, inflation, refinancing, house prices, and the overall housing market are included inthe estimation equations for the housing goal market performance as explanatory variables. Interest Rates. Mortgage interest rates are affected by many factors. Trends in interest rates on longer term financial instruments such as mortgages typically follow the fluctuations of the 10-Year Treasury note yield, with approximately a 167 to 179 basis point spread reflecting the differences in liquidity and credit risk expected for the 2015 through 2017 period. This expected rate spread is higher than what was experienced during the past five years. Overall, interest rates in the United States are heavily influenced by the monetary policies of the Federal Reserve Board’s Federal Open Market Committee (FOMC). Since mid-2008, the FOMC has maintained an accommodative monetary policy in support of its dual mandate of fostering maximum employment and price stability. In its April 28-29, 2015 meeting, the FOMC stated that it is committed to a low federal funds rate policy (at 0 to 0.25 percent) for the time being. The FOMC will also continue to reinvest principal payments from its sizable portfolio of agency securities: “To support continued progress toward maximum employment and price stability, the Committee today reaffirmed its view that the current 0 to 1/4 percent target range for the federal funds rate remains appropriate. In determining how long to maintain this target range, the Committee will assess progress--both realized and expected--toward its objectives of maximum employment and 2 percent inflation. This assessment will take into account a wide range of information, including measures of labor market conditions, indicators of inflation pressures and inflation expectations, and readings on financial and international developments. 6
13) Market Estimates July 2015 The Committee anticipates that it will be appropriate to raise the target range for the federal funds rate when it has seen further improvement in the labor market and is reasonably confident that inflation will move back to its 2 percent objective over the medium term. The Committee is maintaining its existing policy of reinvesting principal payments from its holdings of agency debt and agency mortgage-backed securities in agency mortgage-backed securities and of rolling over maturing Treasury securities at auction. This policy, by keeping the Committee's holdings of longer-term securities at sizable levels, should help maintain accommodative financial conditions.”10 Affordability in the mortgage market depends in part on the interest rate environment. The longer term 30-year fixed-rate mortgage interest rate, after falling to a low of 3.4 percent in the fourth quarter of 2012, gradually rose to 4.0 percent in the fourth quarter of 2014 before falling to 3.7 percent in the first quarter of 2015.11 Shorter term fixed- and adjustable-rate mortgage interest rates remain at historical lows—Freddie Mac reported that the one-year adjustable-rate mortgage rate averaged 2.4 percent for most of 2014 and the first quarter of 2015. As a major contributor to the cost of mortgage financing, lower interest rates directly affect the affordability of buying a home or refinancing a mortgage. As the economic recovery continues, it is expected that interest rates, particularly longer term interest rates, will rise. For the 20152017 period, as shown in Tables 2 and 3, forecasts show that all interest rates are expected to increase, including the interest rate on a 30-year fixed-rate mortgage, which is expected to increase to 4.2 percent by the fourth quarter of 2015, 4.8 percent by the end of 2016 and 10 Federal Reserve Board of Governors. Press Release of the Federal Open Market Committee Statement, April 2829, 2015, April 29, 2015. 11 Freddie Mac, Primary Mortgage Market Survey. (2012-2015). 7
14) 8 5 4 3 2 1 22.8% 2.9% 1.9% 5.0% 3.4% ....... 4.7% 2.40% 97.0 22.4% 2.8% 1.1% 5.1% 2.9% 1.5% 4.3% 1.25% 99.0 21.8% 2.4% 1.9% 5.3% 2.2% 0.4% 3.4% 0.30% 99.1 26.2% 2.4% 1.4% 6.1% 2.5% 0.1% 3.3% 0.09% 87.0 0.0% 2.2% 1.3% 7.4% 2.4% 0.1% 3.3% 0.11% 73.3 22.3% 2.3% 1.9% 8.1% 1.8% 0.2% 3.3% 0.14% 67.0 2.6% 1.1% 5.0% 3.0% 1.8% 4.6% 1.60% 99.0 2.6% 2.0% 5.0% 3.0% 1.6% 4.4% 1.40% 99.0 2.7% 2.0% 5.1% 2.8% 1.4% 4.2% 1.10% 99.0 2.6% 1.8% 5.2% 2.7% 1.1% 4.0% 0.90% 99.0 3.1% 1.9% 5.2% 2.4% 0.7% 3.6% 0.60% 99.0 3.1% 0.9% 5.3% 2.3% 0.5% 3.4% 0.30% 99.0 2.6% 1.0% 5.4% 2.1% 0.3% 3.3% 0.17% 97.1 0.2% 1.3% 5.6% 2.0% 0.2% 3.3% 0.11% 101.4 2.2% 1.4% 5.7% 2.3% 0.1% 3.3% 0.10% 92.8 4.9% 1.5% 6.1% 2.5% 0.1% 3.3% 0.09% 90.9 4.5% 1.5% 6.2% 2.6% 0.1% 3.3% 0.09% 83.4 -2.1% 1.2% 6.6% 2.8% 0.1% 3.3% 0.07% 80.6 3.5% 1.3% 7.0% 2.7% 0.1% 3.3% 0.09% 74.2 4.4% 1.3% 7.2% 2.7% 0.1% 3.3% 0.08% 81.0 1.8% 1.3% 7.5% 2.0% 0.1% 3.3% 0.12% 75.1 2.7% 4.2% 3.5% 7.6% 1.7% 1.9% 1.5% 7.7% 1.9% 0.2% 3.3% 0.14% 62.6 Real GDP 5 Nominal GDP 5 Real Personal Consumption 5 Real Residential Construction 5 5 5 5 Inflation Rate (CPI, Y/Y % Change) Core Infl. Rate (CPI, Y/Y % Change) Core Infl. Rate (PCE, Y/Y % Change) Unemployment Rate 10-Year Treasury Yield 1-Year Treasury Yield Prime Rate Federal Funds Target Rate Consumer Confidence 1.7% 1.6% 10.8% 2.0% 6.1% 1.7% 1.2% -8.8% 3.7% 4.9% 1.6% 1.4% -5.4% 1.2% -0.8% 1.9% 2.1% 8.5% 2.5% 6.7% 1.8% 1.8% 3.2% 3.2% 6.3% 1.7% 1.2% 3.8% 4.4% 2.4% 1.7% -0.1% 1.3% 1.9% 0.1% 1.5% -0.6% 6.3% 3.0% 4.6% 1.6% -0.2% 9.2% 3.1% 5.4% 1.8% 0.9% 10.0% 2.7% 5.3% 1.8% 2.0% 8.0% 10.6% 4.6% 1.8% 2.0% 8.8% 2.4% 4.9% 1.9% 2.1% 9.1% 2.3% 4.7% 2.0% 2.3% 8.2% 2.3% 4.7% 1.9% 1.9% 13.5% 1.8% 4.2% 1.7% 1.2% 11.9% 2.4% 3.7% 1.7% 1.2% 1.6% 2.5% 3.9% 1.8% 0.9% 5.0% 3.0% 3.6% 2.0% 2.3% 8.9% 4.7% 5.0% 13.6% 2.2% 1.6% 8.4% 8.0% 4.8% 14.2% Quarter over quarter change, annual rate. Share of refinance mortgage originations made to low-income borrowers in that quarter (year). Share of home purchase mortgage originations on properties located in low-income areas, excluding those in designated disaster areas, in that quarter (year). Share of home purchase mortgage originations made to very low-income borrowers in that quarter (year). Share of home purchase mortgage originations made to low-income borrowers in that quarter (year). Note: Shaded area indicates historical values. Projected trends are an average forecast of Mortgage Bankers Association (MBA), Fannie Mae, Freddie Mac, National Association of Realtors, Wells Fargo, PNC Financial, Standard and Poor's, the National Association of Home Builders, the Conference Board, the Wall Street Journal Survey, the Federal Open Market Committee, Tading Economics,Raymond James Financial, and the Philadelphia Federal Reserve Bank Survey. 1.7% 1.4% 17.7% 1.8% 2.8% 13.2% 5.7% 23.1% 14.0% 22.0% 21.9% 0.0% 6.0% 22.9% 22.6% 13.6% 5.9% 22.4% 22.2% 16.3% 5.7% 22.0% 22.9% 15.4% 0.0% 0.0% 21.5% 15.6% 7.7% 26.6% 21.1% 16.4% 6.0% 23.2% 22.0% 15.8% 5.6% 22.8% 24.8% 14.9% 6.1% 22.9% 26.2% 15.1% 6.2% 22.6% 2017 26.7% 16.1% 6.1% 22.8% 2016 27.1% 15.5% 5.6% 22.2% 2015 28.0% 14.5% 5.9% 22.1% 2014 26.2% 14.8% 6.1% 22.5% 2013 24.0% 15.9% 5.9% 22.2% 2012 22.6% 14.9% 5.3% 20.9% Q4 4 13.7% 5.8% 22.4% 2016 Q3 Q2 Low-Income Borrower Refi. Share 13.3% 6.0% 23.0% Q1 14.3% 6.4% 24.5% Q4 3 6.0% 23.5% 2015 Q3 Q2 Low-Income Area HP Share 6.2% 23.7% Q1 7.1% Q4 25.5% 2014 Q3 Q2 2 Q1 Low-Income Borrower HP Share Q4 Very Low-Income Borrower HP Share 2013 Q3 Q2 1 Q1 Economic and Mortgage Market Outlook Table 2 Market Estimates July 2015
15) Market Estimates July 2015 5.1 percent in 2017. The 10-Year Treasury note yield is expected to average 2.2 percent in 2015, then rise to 2.9 percent in 2016 and 3.4 percent in 2017. Unemployment. In addition to being an indicator of the health of the economy in general, the employment situation affects the housing market more directly because buying a house is considered a large investment and a long-term commitment that requires stable employment. The unemployment rate has steadily fallen from 9.1 percent in August 2011 to 5.4 percent in April 2015. The labor force participation rate was 62.6 percent in June of 2015, remaining within the narrow band of 62.5 to 63.0 percent over the past year.12 One of the stated objectives of the FOMC’s interest rate policy is fostering maximum employment. Given the foreseeable monetary policy and the continued growth in the economy, the unemployment rate is expected to fall to an average 5.3 percent in 2015, 5.1 percent in 2016 and 5.0 percent in 2017 (see Table 2). To the extent that lower-income jobs are affected more by the employment situation, the affordable home purchase market is affected. Inflation. The second stated objective of the FOMC in determining its interest rate policy is for price stability. As shown in Table 2, industry observers expect core inflation (excluding food and energy) to remain near 2.0 percent through 2017. House Prices. Trends in house prices influence the housing and mortgage markets. In periods of house price appreciation, home sales and mortgage originations may increase as the expected return on investment rises.13 In periods of price depreciation or price uncertainty, home sales and mortgage originations tend to decrease as risk-averse homebuyers are reluctant to enter the market. House prices generally fell during 2009 through 2011, but turned around in 2012 12 Bureau of Labor Statistics, News Release: The Employment Situation – April 2015, (May 8, 2015). House prices and home sales can have a circular relationship, as they had between 2000 and 2006. Rising prices and expectations of further growth caused demand to grow. As demand outpaced supply, house prices rose even more. 13 9
16) Market Estimates July 2015 with an increase of 5.4 percent in FHFA’s Purchase Only Home Price Index. House prices increased at a rate of 7.7 percent in 2013 and 5.1 percent in 2014. House prices are expected to continue to increase at rates of 4.3, 3.8, and 3.4 percent in 2015, 2016, and 2017, respectively (see Table 3). The expected increase in interest rates and house prices leads to an expected decrease in housing affordability. Housing affordability, as measured in Table 3 by NAR’s Housing Affordability Index, is expected to drop from an index of 200 at the end of 2012 to 102 by 2017. Housing Market. An active housing market is generally good for the affordable home market. When there are more homes for sale, potential home buyers have more options, prices tend to be more competitive and the search costs to find affordable housing decrease. Houses for sale volumes, as measured by months’ supply (the ratio of houses for sale to houses sold), reached a seasonally adjusted high of 12.2 houses for sale to every house sold in January 2009, to a low of 3.9 houses for sale to every house sold in January 2013, and has steadily increased since, to 5.3 houses for sale to every house sold in March 2015 (which is just under the long-run average of 6.1).14 Refinance Rate. The size of the refinance mortgage market has an impact on the affordable share of refinance mortgages. Historically, refinance mortgage volume increases when the refinancing of mortgages is motivated by low interest rates (“rate-and-term refinances”), and higher-income borrowers tend to make up a greater share of this increased volume. As a result, in periods of low interest rates, the share of lower-income borrowers will decrease. Likewise, 14 U.S. Census Bureau, “Houses for Sale by Regions and Months’ Supply at Current Sales Rate,” seasonally adjusted numbers. 10
17) 11 12 11 10 * 9 8 7 6 5 4 3 2 1 13.7% 3.5% 2.6% 2.6% 2.3% 7.0% 5 5 6 6 6 7 8 ARM Market Share Investor Share 30-Year Mortgage Fixed Rate 5/1 ARM Rate 1-Year ARM Rate Change in Housing Prices (FHFA ALL) Change in Housing Prices (FHFA PO) Change in Housing Prices (CS HPI) 16.1% 26.5% 12 12 Percent LTVs at least 95% Percent LTVs at least 90% 29.8% 17.8% 78.6% $203 $268 184 11.6% 7.5% 4.3% 2.6% 2.7% 3.7% 12.3% 6% 9% 21% 63% $572 5,101 447 5,548 595 7% 8% 19% 51% $469 5,324 381 5,706 602 883 Q3 29.3% 16.9% 78.8% $207 $262 171 12.7% 8.3% 4.7% 2.7% 3.2% 4.4% 11.7% 2013 867 Q2 32.8% 18.4% 80.0% $197 $272 168 13.7% 7.7% 5.0% 2.6% 3.0% 4.3% 12.5% 8% 8% 19% 46% $326 4,945 446 5,390 652 1,011 Q4 30.8% 18.2% 79.1% $191 $274 165 13.1% 7.0% 5.4% 2.5% 3.1% 4.4% 12.7% 9% 5% 15% 50% $247 4,677 431 5,108 610 933 Q1 32.0% 18.6% 79.2% $212 $282 167 9.4% 5.7% 6.0% 2.4% 3.0% 4.2% 11.6% 10% 8% 18% 40% $297 4,887 427 5,314 624 9% 8% 21% 38% $300 5,056 434 5,490 654 1,029 Q3 28.9% 13.7% 79.0% $216 $278 168 5.7% 4.8% 5.8% 2.4% 3.0% 4.1% 11.6% 2014 984 Q2 31.7% 17.4% 80.0% $208 $301 165 4.3% 5.1% 5.5% 2.4% 3.0% 4.0% 12.3% 9% 6% 18% 46% $278 5,061 471 5,532 700 1,056 Q4 30.8% 16.0% 79.3% $203 $284 167 4.2% 4.5% 4.3% 2.4% 2.9% 3.7% 12.6% 7% 4% 18% 54% $334 4,976 512 5,488 646 977 Q1 32.6% 16.8% 79.7% $218 $293 159 3.7% 3.8% 4.7% 2.5% 2.9% 3.8% 11.5% 8% 4% 20% 43% $399 5,134 513 5,694 716 9% 4% 20% 37% $339 5,232 527 5,759 762 1,128 Q3 32.8% 16.1% 79.9% $222 $291 149 3.2% 4.1% 4.7% 2.6% 3.1% 4.0% 11.5% 2015 1,094 Q2 33.3% 16.5% 80.2% $216 $299 144 3.1% 4.3% 4.8% 2.7% 3.3% 4.2% 12.1% 9% 5% 20% 38% $292 5,136 536 5,672 797 1,178 Q4 32.5% 16.3% 79.7% $217 $296 139 2.6% 3.8% 4.6% 3.1% 3.5% 4.4% 12.6% 11% 4% 20% 35% $248 5,318 591 5,909 869 1237 Q1 33.6% 16.8% 80.2% $227 $301 115 2.7% 3.9% 4.6% 3.2% 3.7% 4.6% 11.5% 12% 4% 20% 30% $341 5,338 604 5,942 899 12% 4% 20% 30% $340 5,361 613 5,974 920 1292 Q3 33.2% 15.9% 80.3% $229 $299 105 2.7% 3.9% 4.6% 3.3% 3.9% 4.7% 11.5% 2016 1269 Q2 33.6% 16.2% 80.6% $225 $305 105 2.8% 3.8% 4.5% 3.4% 4.1% 4.8% 12.1% 13% 5% 20% 29% $279 5,387 620 6,007 932 1303 Q4 FHFA Monthly Interest Rate Survey Thousands of dollars National Association of Realtors Freddie Mac's Conventional Mortgage Home Price Index (Y/Y % Change, Annual Rate) Standard & Poor's Case-Shiller 10 City Index (Y/Y % Change, Seasonally Adjusted) FHFA House Price Index, purchase transactions only (Y/Y % Change, Seasonally Adjusted) FHFA House Price Index, all transactions (Y/Y % Change) Freddie Mac, Primary Mortgage Market Survey HMDA data. The refinance shares for 2012-2013 are calculated from Home Mortgage Disclosure Act (HMDA) data. Preliminary estimates in 2014 are as reported by MBA. FHFA and MBA, Billions of dollars Thousands of units, forecasted amount does not equal the sum of the existing plus new home sales because of differences in forecasts. Thousands of units of Home Builders, Standard and Poor's, the Wall Street Journal Survey, the Conference Board, Raymond James Financial, the Federal Reserve Bank of Philadelphia and the Federal Open Market Committee. Note: Shaded area indicates historical values. Forecasts are an average forecast of Mortgage Bankers Association (MBA), Fannie Mae, Freddie Mac, National Association of Realtors, Wells Fargo, PNC Financial,the National Association $176 77.2% 11 Average LTV 12 Median Sales Price - Existing Homes 5% 5 FHA Refinance Market Share $258 10% 5 FHA Home Purchase Market Share 11 24% 4 Refinance Mortgage Share Median Sales Price - New Homes 74% 3 Single-Family Originations 195 $477 1 8.6% 447 4,926 1 New Home Sales Existing Home Sales 10 5,373 2 Total Home Sales Housing Affordability Index 631 1 Housing Starts, 1-Unit 9 952 1 Housing Starts Q1 Housing and Mortgage Market Outlook Table 3 24.0% 13.9% 77.0% $175 $242 200 4.6% 5.4% 0.7% 2.7% 2.8% 3.7% 13.2% 5% 6% 26% 69% $2,044 4,662 368 5,030 537 784 2012 29.6% 17.3% 78.7% $196 $265 168 13.7% 7.7% 5.0% 2.6% 2.9% 4.0% 12.6% 7% 7% 21% 58% $1,845 5,074 430 5,505 620 928 2013 30.8% 17.0% 79.3% $207 $284 165 4.3% 5.1% 5.5% 2.4% 3.0% 4.2% 12.1% 9% 7% 18% 43% $1,122 4,922 441 5,363 647 1,001 2014 32.4% 16.3% 79.8% $215 $292 144 3.1% 4.3% 4.8% 2.6% 3.1% 3.9% 11.9% 8% 4% 19% 43% $1,364 5,120 522 5,654 731 1,095 2015 33.2% 16.3% 80.2% $224 $300 105 2.8% 3.8% 4.5% 3.3% 3.8% 4.6% 11.9% 12% 4% 20% 31% $1,208 5,351 607 5,958 905 1,275 2016 33.2% 15.9% 80.4% $229 ....... 102 3.4% 3.4% ....... ....... ....... 5.1% 11.9% 12% 5% 20% 22% $1,161 5,414 550 5,964 ....... 1,247 2017 Market Estimates July 2015
18) Market Estimates July 2015 refinancings that occurred when interest rates were high tended to have a higher proportion of lower-income homeowners who were consolidating their debts or who were drawing equity out of their homes for other uses. In 2014, for the first time in more than five years, less than half of mortgage originations are expected to be for the purpose of refinancing an existing mortgage. As interest rates continue to rise, the share of originations from refinancing is expected to fall to 38 percent of mortgage originations in the fourth quarter of 2015, 29 percent by the end of 2016, and 22 percent in 2017 (see Table 3). Market Performance of Housing Goal-Eligible Mortgages. The estimates of the market performance for the two single-family, owner-occupied home purchase housing goals and one subgoal, and the refinancing mortgage housing goal, are provided at the top of Table 2. The estimates for the low-income borrower shares of the home purchase mortgage market are 22.4 percent in 2015, 22.9 percent in 2016 and 22.0 percent in 2017. The estimates for the very lowincome borrower shares of the home purchase mortgage market are 5.9, 6.0 and 5.7 percent, respectively, in 2015, 2016 and 2017. The estimates for the share of goal-qualifying mortgages in low-income areas in the home purchase mortgage market, excluding designated disaster areas, are 13.2 percent of home purchase mortgages in 2015, 13.6 percent in 2016 and 14.2 percent in 2017. The estimates for the low-income refinancing goal are 21.8 percent in 2015, 22.4 percent in 2016 and 22.8 percent in 2017. To arrive at these market projections, forecasts were compiled from thirteen industry and government sources (industry observers). The list of forecasters, along with each forecaster’s annualized projections for 2015 through 2017 of the market indicators, is provided in Table 4 12
19) 13 17 16 15 14 13 12 11 10 9 8 7 6 5 4 3 2 1 Average 17 2.4% 2.1% 2.9% 2.8% 2.5% 3.2% 5/15/2015 8.9% 7.5% 8.8% 6.7% 4.1% 6.5% 11.6% 5.0% 5.7% 5.2% 5/15/2015 , survey of 45 forecasters. 5/13/2015 5/18/2015 3/18/2015 , midpoint of the central tendency projection. 5/1/2015 , survey of 57 forecasters. 5/13/2015 5.8% 9.4% 8.4% 5.8% 9.4% 2017 2.3% 0.1% 1.6% 1.4% 1.7% 1.9% 2.1% 0.3% 0.9% 0.9% 1.7% 3.2% 1.7% 2.3% 2.1% -0.1% 2.2% 1.7% 2.2% 0.1% 2015 2016 2017 1.6% 2.4% 1.5% 2.2% 1.2% 2.3% 1.2% 3.2% 1.0% 2.3% 1.5% 2.2% 2.3% 2.2% 2.2% (CPI) 2 Inflation Rate Averages include actual values for months when available. Therefore the average line may not equal the average of the above numbers. Last Updated Last Updated Last Updated Last Updated Last Updated Last Updated 4/30/2015 5/21/2015 Last Updated Last Updated 2.3% 2.9% 2.9% 2.9% 2.6% 2.3% 2.7% 4.8% 9.0% 6.5% 6.7% 4.6% 11.6% 2015 2016 4.1% 10.1% 4.2% 8.5% 5/13/2015 , U.S. Economic Forecast and 4/30/2015 , U.S. Housing Market Forecast. 5/1/2015 5/15/2015 5/11/2015 5/18/2015 Last Updated Last Updated Last Updated Last Updated Last Updated Last Updated Fourth Quarter over Fourth Quarter Percent Change. Forecasts are annual averages of quarterly forecasts, where applicable. Minimum Maximum 2.5% 2.9% 2.5% 3.2% 2.5% 2.8% 2016 2017 2.7% 2.8% 2.8% 3.0% 3.0% 2.9% 2.4% 3.0% 2.8% Growth Rate Growth Rate 2015 Forecast Mortgage Bankers Assiociation 3 2.4% Fannie Mae 4 2.4% Freddie Mac 5 2.5% National Association of Realtors 6 2.5% Wells Fargo 7 2.3% PNC Financial 8 2.8% Standard and Poor's 9 2.4% National Association of Home Builders 10 The Conference Board 11 2.2% Wall Street Journal Survey 12 2.5% Federal Open Market Committee 13 2.9% Trading Economics 14 2.6% Raymond James Financial 15 2.1% Philadelphia FRB Survey 16 2.4% 1 Residential Constr. Real GDP 2016 1.8% 1.6% 1.8% 1.6% 1.8% 1.8% 1.8% 1.8% 2.3% 1.9% 2.3% 1.8% 2.0% 1.9% 2.0% 1.6% 1.7% 2.0% 2015 1.9% 2.3% 1.7% 2.1% 2.3% 1.9% 2017 2 (Core CPI) Inflation Rate 1.7% 2016 1.3% 5.6% 1.2% -1.3% 1.7% 1.5% 1.4% 1.7% 5.6% -1.3% 1.4% 1.7% 1.4% 1.7% 1.3% 2015 1.8% 1.9% 1.3% 1.8% 1.8% 1.9% 1.8% 2017 2 (Core PCE) Inflation Rate 5.1% 5.4% 5.3% 5.3% 5.1% 5.4% 5.3% 5.4% 4.8% 6.0% 5.1% 4.9% 5.0% 6.0% 4.8% 5.0% 4.7% 6.1% 5.0% 4.8% 4.8% 5.0% 6.1% 2015 2016 2017 5.4% 5.1% 5.4% 5.0% 5.4% 5.1% 5.4% 5.3% 5.4% 5.0% 5.3% 4.9% 4.7% 5.3% 5.0% 4.9% Rate Unemployment Forecasts of Economic Indicators by Source Table 4 2.1% 2.4% 2.2% 2.4% 2.3% 2.2% 2.3% 2.4% 3.3% 2.9% 3.2% 3.1% 2.9% 3.2% 2.7% 3.7% 3.4% 3.5% 3.4% 3.6% 2015 2016 2017 2.2% 3.0% 2.1% 2.4% 2.1% 3.0% 2.2% 3.3% 2.2% 2.7% 2.1% 2.4% 2.7% 2.2% 2.9% 3.7% 2.1% 2.7% Treas. Yield 10-Year Const. Mat. 2016 0.4% 0.4% 0.5% 1.1% 1.9% 1.5% 1.5% 0.4% 0.5% 0.5% 1.1% 1.9% 2015 2017 Treas. Yield 1-Year Const. Mat. 3.3% 3.5% 3.4% 3.4% 3.3% 3.5% 3.4% 3.3% 2015 4.0% 4.6% 4.3% 4.1% 4.3% 4.6% 4.6% 4.0% 2016 Rate Prime 4.5% 4.8% 4.7% 4.5% 4.8% 2017 0.2% 0.4% 0.3% 0.2% 0.4% 0.4% 0.4% 0.2% 0.3% 0.3% 0.7% 1.7% 1.3% 0.8% 1.5% 1.6% 1.6% 1.0% 1.4% 1.3% 1.8% 2.7% 2.4% 2.7% 1.8% 2.7% 2015 2016 2017 0.4% 1.7% 0.2% 0.7% Rate Federal Funds Market Estimates July 2015
20) Market Estimates July 2015 and Table 5. The forecasts are all provided on either a quarterly or annual basis for each market indicator. An econometric state space methodology was used to extend the trends of the market performance for each goal, based on the monthly time series database provided by the FFIEC and the Federal Reserve Board. For the low-income areas goal, this model produced only the market estimates for the subgoal. The remainder of the market estimates for this goal relates to the designated disaster areas. The 2015 through 2017 estimates of the share of home purchase mortgages that will qualify for the designated disaster areas portion of the low-income areas goal will be provided separately, based on data provided by the Federal Emergency Management Agency (FEMA).15 15 http://www.fema.gov/disasters. 14
21) 15 8 7 6 5 4 3 2 1 Average Minimum Maximum 4 4 1,275 3.9% 4.1% 5.2% 4.6% 4.8% 4.2% 4.4% 5.8% 5.1% 5.1% 4.4% 5.8% 2017 2016 3.0% 3.0% 3.4% 4.2% 3.8% 3.0% 3.0% 3.1% 3.4% 4.2% 2015 Rate 793 990 905 977 5/1 ARM 704 761 731 704 990 793 761 741 30-Year Mortgage 2016 4.9% 4.1% 4.9% 5.2% 4.5% 4.2% 4.7% 4.4% 3.8% 4.2% 1,247 1,102 1,500 2016 843 921 2015 709 740 Fixed Rate 1,072 1,400 1,102 1,139 1,500 2017 (1-Unit)2 2016 1,228 1,319 1,400 1,390 1,225 1,081 1,400 1,342 1,320 1,276 1,072 Starts 2 2015 4.1% 3.8% 4.0% 4.0% 4.0% 3.9% 3.9% 3.9% 1,016 1,144 1,095 2015 1,075 1,106 1,144 1,134 1,139 1,016 1,119 1,054 1,090 1,079 1,037 Housing 2017 2017 2.5% 2.7% 2.6% 2.5% 2.6% 2.5% 2.7% 2.6% 2015 5,505 5,840 5,654 5,505 2015 5,641 5,646 5,607 5,840 5,622 5,698 2.9% 4.1% 3.3% 3.3% 3.0% 2.9% 4.1% 3.0% 2016 Rate 1-Year ARM 5,649 6,210 5,958 5,649 2016 5,980 5,890 5,800 6,210 5,990 5,918 Home Sales 2 Total 2017 5,769 6,158 5,964 5,769 6,158 2017 4.4% 5.0% 4.8% 4.4% 2015 5.0% 4.2% 4.6% 4.5% 4.2% 2016 4.6% (FHFA ALL) 2017 4.3% 4.3% 6.9% 3.7% 5.1% 3.8% 5.1% 4.8% 4.8% 6.9% 3.7% 2016 (FHFA PO) 4.3% 2015 5,153 5,490 5,351 5,153 5,490 5,400 5,376 5 5,038 5,264 5,120 5,038 5,264 5,104 5,177 2016 5,418 5,269 Home Sales 2 2015 5,129 5,116 Change in Home Prices 520 580 550 520 580 2017 5 496 720 607 496 718 720 590 543 2016 562 621 Existing Change in Home Prices 468 576 522 468 529 576 518 520 2015 512 529 Home Sales 2 New 3.8% 5.5% 3.4% 5.5% 4.8% 3.8% 2017 5,249 5,578 5,414 5,249 5,578 2017 $293 $319 $1,208 2016 $293 $295 $319 1.1% 4.5% 3.1% 4.5% 4.0% 3.1% 1.1% 2015 0.9% 4.3% 2.8% 4.3% 3.8% 2.9% 0.9% 2016 2017 3.4% 3.7% 3.4% 3.7% 3.4% 2017 6 (Case-Shiller) Change in Home Prices $1,281 $1,460 $1,364 2015 $1,281 $1,460 $1,350 Originations 3 SingleFamily Thousands of dollars Housing Affordability Index (4th Quarter), National Association of Realtors. Forecasts are scaled to NAR's quarterly HAI series. Standard & Poor's / Case-Shiller Home Price Index, 10-City Composite (Q4/Q4 % Change). Federal Housing Finance Agency: All transactions and home Purchase only home price indicies (Q4/Q4 % Change). Averages include actual values for months when available. Therefore the average line may not equal the average of the above numbers. Billions of dollars Thousands of units housing forecast table (see Table 2). Forecasts are annual averages of quarterly forecasts, where applicable. See Table 2 for update information. The FOMC and Raymond James & Associates only provide forecasts on basic macroeconomic series and therefore are omitted from the mortgage/ 1 Forecast Mortgage Bankers Assiociation Fannie Mae Freddie Mac National Association of Realtors Wells Fargo PNC Financial Standard and Poor's National Association of Home Builders The Conference Board Wall Street Journal Survey Trading Economics Philadelphia FRB Survey Minimum Maximum Average Forecast1 Mortgage Bankers Assiociation Fannie Mae Freddie Mac National Association of Realtors Wells Fargo PNC Financial Standard and Poor's National Association of Home Builders The Conference Board Wall Street Journal Survey Trading Economics Federal Open Market Committee Philadelphia FRB Survey Housing Starts 144 144 144 144 2015 29.5% 32.8% 30.9% 2016 32.8% 32.8% 29.5% Rate Refinance Mortgage 7 105 105 105 105 2016 Index Housing Affordability 42.7% 48.0% 42.9% 2015 42.7% 48.0% 42.8% Forecasts of Housing and Mortgage Market Indicators by Source Table 5 2017 2017 2016 Share 20.0% 20.0% $289 $294 $292 $293 $291 2015 $289 $294 $289 $307 300 $301 $304 2016 $289 $307 New Homes 8 Median Sales Price - 20.4% 20.4% 20.0% 20.4% 19.5% 20.0% 2015 FHA Market 2017 2017 2016 Share 9.0% 14.5% $210 $219 $215 $219 $214 2015 $210 $216 $216 $230 $224 $230 $227 2016 $216 $225 2017 8 2017 Existing Homes Median Sales Price - 7.8% 8.1% 11.8% 7.8% 8.1% 7.9% 9.0% 14.5% 2015 ARM Market Market Estimates July 2015
22) Market Estimates July 2015 D. STATISTICAL MODELS OF THE SINGLE-FAMILY HOUSING GOALS To estimate the 2015 through 2017 market shares for the four single-family housing goals, a state space form (SSF) is incorporated with the associated algorithms of the Kalman filter and smoother.16 This SSF approach is a method by which the time series gap left by the HMDA data can be statistically extended with a similar time series which is highly correlated with it. For the home purchase goals, an estimate of monthly market affordability levels for the home purchase goals from FHFA’s MIRS data is used.17 The market size for the refinance goal is estimated using the SSF approach with the combined Fannie Mae and Freddie Mac 3-month moving average goal shares for January 2004 – April 2015 as the second signal. The forecast models are estimated using HMDA data for the years 2004 through 2013, as there were several significant changes in HMDA reporting beginning in 2004. A discussion on why this time series is used, as well as a comparison of results from this time series and an alternative longer time series, is provided in Appendix E. Several specifications of the auto-regressive (AR) model were tested for each housing goal. All of the time series, both the dependent (goal-qualifying share) and independent (explanatory), were found to be stationary when integrated at the first level.18 While several exogenous variables had the expected sign, many were found to be insignificant at a 10 percent level of confidence. The equations were fitted with monthly binary variables to capture seasonality effects, as opposed to moving average terms which have no forecasting value. 16 The methodology followed is an adaptation of a state space model developed by Freddie Mac, Housing Analysis and Research. For a thorough discussion of the state space approach, see Harvey, Andrew, “Forecasting with Unobserved Components Time Series Models,” in Handbook of Economic Forecasting, G. Elliott, C.W.J. Granger and A. Timmermann eds., North Holland, 2006, pp. 327-412. 17 This is an estimated time series of 3-month moving average goal-qualifying shares based on MIRS data from January 2004 through April 2015. 18 In simple terms, a stationary time series has no trend, has a constant variance over time, has a constant autocorrelation structure, and has no periodic fluctuations (seasonality). 16
23) Market Estimates July 2015 For each housing goal, four alternative specifications are presented, in addition to a reestimated (with 2013 HMDA data) model specification used in the proposed rule.19 The Full Model includes all possible explanatory variables, whether they have a significant impact or not. For explanatory variable categories where there are several variables to choose from (e.g., the category of volume includes home sales, housing starts and mortgage originations), at least one variable will be included in the model specification and all variables with a significant impact will be included. In addition to all possible explanatory variables, the Full Model w/2004-07 includes a set of monthly binary variables for the years 2004 through 2007 to capture time specific effects of the mortgage boom period. The Best Fit Model includes explanatory variables that provide the best fit specification, as determined by significance of the variable, low model variance, minimizing white noise, and model goodness of fit.20 The Best Fit Model w/2004-07 is the best fit specification when the 2004 through 2007 binary monthly variables are included. All of the models are first-differenced and the hypothesis of non-stationarity for the first order integrated time series can be rejected. Low-Income Borrower Home Purchase Goal. Table 6 shows the four model specifications analyzed for the Low-Income Borrower Home Purchase Goal (LIP) plus the model used in the proposed rule, re-estimated using updated HMDA data. The Best Fit Model provides the best model for forecasting this goal. The Akaike Information Criterion (AIC) statistic for this specification is lowest, indicating it has the best goodness of fit. It also does the best of all the specifications in reducing white noise, as determined by the Chi Square statistic. Additional diagnostic information is provided in Appendix A. 19 79 Federal Register 176 (September 11, 2014), p. 54482. In the following tables, white noise is minimized when the probability of a larger Chi Square statistic (i.e., P(>χ 2)) is highest. A better goodness of fit is determined by the lowest (most negative) Akaike Information Criterion statistic. 20 17
24) Market Estimates July 2015 The best fitting equation was found to be a first differenced seasonal AR model with four autoregressive terms, with AR(2) and AR(4) being significant at the five percent level. In addition to the time series components, drivers of this housing goal include the unemployment rate lagged one month, log of the Core CPI year over year change, the 10-Year Treasury yield lagged one month, the 30-year fixed mortgage rate, log of median price of existing homes sold, log of FHFA’s House Price Index (HPI) lagged one month, log of NAR’s Home Affordability Index (HAI), log of total home sales, log of single-family housing starts, share of Adjustable Rate Mortgages (ARM) lagged three months, and share of mortgages on owner-occupied properties. The Chi-Square statistic indicates that the hypothesis that the residuals are white noise cannot be rejected. The forecasts for the Low-Income Borrower Home Purchase Goal are shown in Figure 1. While the SSF provides the best forecast, the forecast based on HMDA data alone is also shown. The SSF forecast averages 22.4, 22.9 and 22.0 percent in 2015 through 2017, respectively. The 2017 confidence interval is plus or minus 5.0 percent, which is smaller than the same interval for the model used in the proposed rule. Also, for reference, the figure is annotated with the 20102011 goal benchmark (27 percent) and the 2012-2014 benchmark (23 percent). 18
25) Market Estimates July 2015 Table 6 Low-Income Borrower Home Purchase Goal Full Model w/ 2004-07 -0.075 ( 0.126 ) Best Fit w/ 2004-07 -0.227 ** ( 0.110 ) Full Model -0.132 ( 0.109 ) Best Fit Model -0.169 ( 0.105 ) AR(2) 0.456 *** ( 0.121 ) 0.259 ** ( 0.113 ) 0.345 *** ( 0.111 ) 0.256 ** ( 0.108 ) AR(3) -0.026 ( 0.129 ) 0.060 ( 0.113 ) -0.041 ( 0.110 ) -0.021 ( 0.108 ) AR(4) -0.307 ** ( 0.129 ) -0.211 * ( 0.110 ) -0.256 ** ( 0.110 ) -0.231 ** ( 0.105 ) AR(5) 0.089 ( 0.122 ) AR(6) 0.229 * ( 0.120 ) Unemplment Ratet-1 0.517 ( 0.326 ) 0.446 ( 0.279 ) 0.464 * ( 0.264 ) -0.166 *** ( 0.064 ) -0.146 ** ( 0.060 ) AR(1) Ln(Core CPIY/Y) -0.221 ** ( 0.100 ) 0.000 * ( 0.000 ) 10-Year Treas. Yieldt-1 Interest Rates Consumer Confidence -0.458 ** ( 0.203 ) -0.137 * ( 0.081 ) 30-Year Fixed Mort. Rate House Prices Ln(HPI)t-1 -0.582 *** ( 0.194 ) -0.653 *** ( 0.251 ) -0.628 ** ( 0.253 ) -0.691 ** ( 0.313 ) -0.266 ( 0.265 ) -0.106 *** ( 0.035 ) -0.086 *** ( 0.031 ) -0.646 ** ( 0.295 ) Volume ARM Sharet-3 Owner-Occupied Share -0.248 ( 0.218 ) 0.053 ( 0.046 ) 0.125 * ( 0.071 ) 0.068 * ( 0.040 ) 0.041 *** ( 0.014 ) 0.042 *** ( 0.014 ) 0.012 ** ( 0.006 ) 0.058 *** ( 0.014 ) -0.177 *** ( 0.047 ) 0.073 * ( 0.041 ) 0.049 *** ( 0.015 ) -0.185 *** ( 0.048 ) 0.147 * ( 0.076 ) 0.230 ** ( 0.097 ) Ln(Housing Starts) FHA Share 0.744 ** ( 0.320 ) -0.365 *** ( 0.091 ) Ln(HAI) Ln(Home Sales) 0.235 ** ( 0.100 ) 0.000 ( 0.000 ) Rate Spread Ln(Med. Price, Exist. Homes) Model Used in Prop. Rule -0.106 ( 0.099 ) -0.143 *** ( 0.032 ) 0.011 ** ( 0.006 ) 0.090 *** ( 0.012 ) 0.031 ( 0.044 ) -0.068 ** ( 0.032 ) -0.058 * ( 0.033 ) -0.092 *** ( 0.031 ) -0.095 *** ( 0.032 ) 0.355 *** ( 0.127 ) 0.549 *** ( 0.108 ) 0.517 *** ( 0.119 ) 0.570 *** ( 0.105 ) Average LTV 0.105 ( 0.066 ) 0.079 ( 0.062 ) Percent LTVs at least 90% -0.036 ( 0.025 ) -0.016 ( 0.023 ) [ ---------------------------------------------- Monthly Binary Variables ---------------------------------------------- ] [2004-2007 Monthly Binary Variables] s2 0.000022 (0.004667) 0.000023 (0.004762) 0.000021 (0.004591) 0.000021 (0.004596) 0.000028 (0.005313) c 8.010 9.430 4.210 3.640 10.430 0.238 -898.930 +/- 8.4% 0.307 -907.146 +/- 5.2% 0.838 -909.839 +/- 5.3% 0.888 -920.310 +/- 5.1% 0.404 -892.211 +/- 8.0% 2 2 P(>c ) AIC 95% Confidence Interval (2017) Standard Errors are reported in parantheses. * indicates significance at the 90% level. ** indicates significance at the 95% level. *** indicates significance at the 99% level. 19
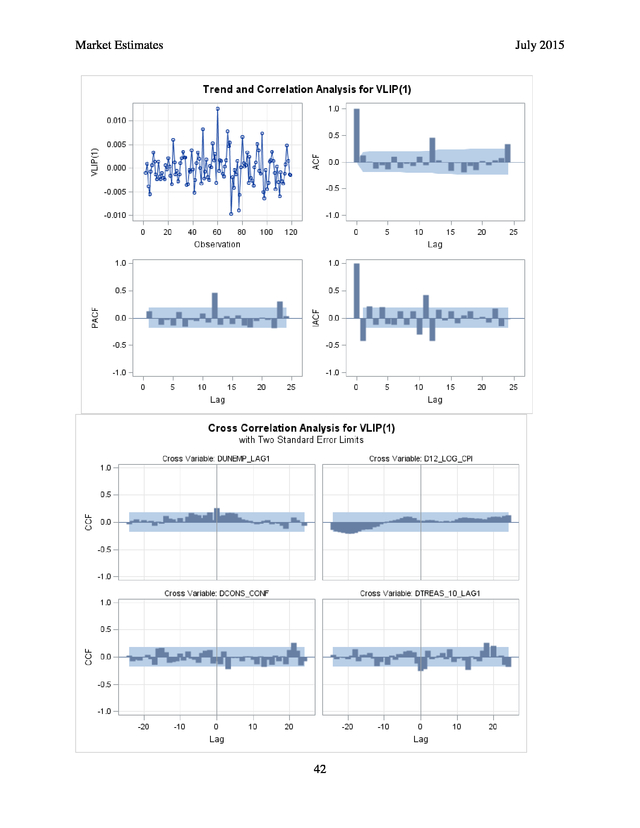
26) Market Estimates July 2015 Very Low-Income Borrower Home Purchase Goal. Table 7 shows the four model specifications analyzed for the Very Low-Income Borrower Home Purchase Goal (VLIP) plus the model used in the proposed rule, re-estimated using updated HMDA data. The Best Fit Model is provides the best model for forecasting this goal. The AIC statistic for this specification is lowest, indicating it has the best goodness of fit. It also does the best of all the specifications in reducing white noise, as determined by the Chi Square statistic. Additional diagnostic information is provided in Appendix A. 20
27) Market Estimates July 2015 The best fitting equation was found to be a first differenced seasonal AR model with two autoregressive terms, with AR(2) being significant at the one percent level. In addition to the time series components, drivers of this housing goal include the unemployment rate lagged one month, log of the Core CPI year over year change, the 10-Year Treasury yield lagged one month, log of median price of existing homes sold, log of total home sales, and log of mortgage originations lagged two months. The Chi-Square statistic indicates that the hypothesis that the residuals are white noise cannot be rejected. The forecasts for the Very Low-Income Borrower Home Purchase Goal are shown in Figure 2. While the SSF provides the best forecast, the forecast based on HMDA data alone is also shown. The SSF forecast averages 5.9, 6.0 and 5.7 percent in 2015 through 2017, respectively. The 2017 confidence interval is plus or minus 3.8 percent, which is slightly larger than the same interval for the model used in the proposed rule. Also, for reference, the figure is annotated with the 2010-2011 goal benchmark (8 percent) and the 2012-2014 benchmark (7 percent). 21
28) Market Estimates July 2015 Table 7 Very Low-Income Borrower Home Purchase Goal AR(1) AR(2) Full Model w/ 2004-07 0.013 ( 0.113 ) Best Fit w/ 2004-07 0.004 ( 0.110 ) Full Model 0.003 ( 0.105 ) Best Fit Model -0.001 ( 0.101 ) 0.337 *** ( 0.122 ) 0.244 ** ( 0.111 ) 0.353 *** ( 0.108 ) 0.305 *** ( 0.100 ) AR(3) Inflation Unemplment Ratet-1 Interest Rates Consumer Confidence 10-Year Treas. Yieldt-1 0.316 ** ( 0.141 ) House Prices 0.290 ** ( 0.129 ) 0.350 ** ( 0.137 ) 0.283 ** ( 0.125 ) 0.545 *** ( 0.115 ) 0.587 ** ( 0.229 ) -0.138 *** ( 0.046 ) -0.081 ** ( 0.039 ) 0.000 ( 0.000 ) -0.265 *** ( 0.092 ) 30-Year Fixed Mort. Rate -0.029 * ( 0.015 ) -0.120 *** ( 0.033 ) -0.106 *** ( 0.030 ) 0.000 ( 0.000 ) -0.239 *** ( 0.087 ) -0.004 ( 0.120 ) Ln(Med. Price, Exist. Homes) -0.362 *** ( 0.108 ) -0.238 *** ( 0.083 ) -0.141 ( 0.133 ) -0.030 ** ( 0.014 ) -0.064 *** ( 0.020 ) -0.034 *** ( 0.012 ) Ln(HPI) -0.042 ( 0.042 ) Ln(HPI)t-1 0.021 ( 0.043 ) Ln(HAI) 0.032 * ( 0.017 ) Ln(Home Sales) Volume -0.121 ( 0.103 ) -0.315 *** ( 0.102 ) Ln(Core CPIM/M) Ln(Core CPIY/Y) Model Used in Prop. Rule 0.123 ( 0.103 ) 0.027 *** ( 0.006 ) Ln(Housing Starts) 0.027 *** ( 0.005 ) 0.000 *** ( 0.000 ) 0.027 *** ( 0.006 ) 0.027 *** ( 0.005 ) 0.000 *** ( 0.000 ) Ln(Mortgage Originations)t-2 -0.003 * ( 0.002 ) -0.004 ** ( 0.002 ) -0.003 * ( 0.002 ) FHA Share 0.033 ( 0.023 ) 0.016 ( 0.021 ) ARM Share -0.025 * ( 0.015 ) -0.013 ( 0.014 ) Owner-Occupied Share -0.076 ( 0.055 ) -0.041 ( 0.052 ) Average LTV 0.058 * ( 0.031 ) 0.025 ( 0.028 ) Percent LTVs at least 95% -0.022 * ( 0.012 ) -0.003 * ( 0.002 ) -0.014 ( 0.011 ) [ ---------------------------------------------- Monthly Binary Variables ---------------------------------------------- ] [2004-2007 Monthly Binary Variables] s 2 0.000004 (0.002018) 0.000004 (0.002035) 0.000004 (0.002022) 0.000004 (0.002016) 0.000005 (0.002325) c 2 2.290 2.360 2.650 1.990 8.910 0.683 -1099.230 +/- 3.8% 0.670 -1110.980 +/- 3.3% 0.618 -1105.580 +/- 3.8% 0.737 -1122.010 +/- 3.8% 0.031 -1088.620 +/- 2.2% 2 P(>c ) AIC 95% Confidence Interval (2017) Standard Errors are reported in parantheses. * indicates significance at the 90% level. ** indicates significance at the 95% level. *** indicates significance at the 99% level. 22
29) Market Estimates July 2015 Low-Income Areas Home Purchase Subgoal. Table 8 shows the four model specifications analyzed for the Low-Income Areas Home Purchase Subgoal (LAP) plus the model used in the proposed rule, re-estimated using updated HMDA data. The Best Fit Model with 2004-2007 Monthly Binary Variables provides the best model for forecasting this goal. The AIC statistic for this specification is lowest, indicating it has the best goodness of fit. While this model specification does not do as well as the other model when it comes to reducing white noise, as determined by the Chi Square statistic, the difference is not great. Additional diagnostic information is provided in Appendix C. 23
30) Market Estimates July 2015 The best fitting equation was found to be a first differenced seasonal AR model with three autoregressive terms, with AR(2) and AR(3) being significant at the level of at least ten percent. In addition to the time series components, drivers of this housing goal include the unemployment rate, log of the Core CPI year over year change lagged three months, the consumer confidence level lagged one month (although the magnitude of its impact is minimal), the 30-year fixed mortgage rate lagged one month, and the log of single-family housing starts lagged two months. The Chi-Square statistic indicates that the hypothesis that the residuals are white noise cannot be rejected. The forecasts for the Low-Income Areas Home Purchase Subgoal are shown in Figure 3. While the SSF provides the best forecast, the forecast based on HMDA data alone is also shown. The SSF forecast averages 13.2, 13.6 and 14.2 percent in 2015 through 2017, respectively. The 2017 confidence interval is plus or minus 3.6 percent, which is smaller than the same interval for the model used in the proposed rule. Also, for reference, the figure is annotated with the 20102011 goal benchmark (13 percent) and the 2012-2014 benchmark (11 percent). 24
31) Market Estimates July 2015 Table 8 Low-Income Areas Home Purchase Subgoal Full Model w/ 2004-07 -0.228 ** ( 0.109 ) Best Fit w/ 2004-07 -0.087 ( 0.106 ) Full Model -0.223 ** ( 0.106 ) Best Fit Model -0.219 ** ( 0.106 ) -0.306 *** ( 0.110 ) -0.226 ** ( 0.108 ) -0.129 ( 0.110 ) -0.149 ( 0.109 ) -0.170 * ( 0.102 ) 0.191 * ( 0.116 ) 0.033 ( 0.115 ) 0.023 ( 0.113 ) 0.161 ( 0.103 ) AR(4) -0.186 * ( 0.111 ) -0.179 ( 0.111 ) -0.096 ( 0.104 ) AR(5) -0.241 ** ( 0.113 ) -0.220 * ( 0.113 ) 0.097 ( 0.102 ) AR(1) AR(2) AR(3) AR(6) Unemplment Rate 0.049 ( 0.103 ) -0.675 *** ( 0.199 ) -0.491 ** ( 0.200 ) -0.702 *** ( 0.193 ) -0.646 *** ( 0.186 ) 0.646 * ( 0.342 ) 0.571 * ( 0.339 ) Inflation Interest Rates Ln(Core CPIM/M)t-1 0.696 * ( 0.417 ) Ln(Core CPIY/Y)t-3 0.147 *** ( 0.050 ) 0.100 * ( 0.054 ) 0.156 *** ( 0.041 ) 0.000 *** ( 0.000 ) 0.000 * ( 0.000 ) 0.000 ** ( 0.000 ) 0.000 ** ( 0.000 ) 30-Year Fixed Mort. Rate -0.117 ( 0.195 ) 30-Year Fixed Mort. Ratet-1 0.363 * ( 0.212 ) 0.445 ** ( 0.210 ) Ln(Med. Price, Exist. Homes) House Prices -0.523 ** ( 0.216 ) 0.156 *** ( 0.040 ) Consumer Confidencet-1 -0.056 ** ( 0.025 ) -0.058 ** ( 0.025 ) -0.046 * ( 0.028 ) -0.136 *** ( 0.053 ) Ln(HPI) -0.042 ( 0.028 ) -0.125 ** ( 0.052 ) Ln(HAI)t-1 Ln(Housing Starts) Volume Model Used in Prop. Rule -0.070 ( 0.101 ) 0.026 ( 0.017 ) -0.004 ( 0.005 ) Ln(Housing Starts)t-2 0.008 ** ( 0.004 ) 0.008 * ( 0.004 ) 0.009 ** ( 0.004 ) FHA Share -0.075 ** ( 0.033 ) -0.150 *** ( 0.034 ) -0.137 *** ( 0.033 ) ARM Share 0.042 ( 0.028 ) 0.064 ** ( 0.025 ) 0.062 ** ( 0.025 ) Owner-Occupied Share 0.145 * ( 0.075 ) 0.329 *** ( 0.082 ) 0.299 *** ( 0.078 ) Average LTVt-1 -0.029 ( 0.044 ) -0.039 ( 0.037 ) -0.035 ** ( 0.016 ) -0.038 *** ( 0.014 ) Percent LTVs at least 90%t-2 -0.036 ** ( 0.015 ) [ ---------------------------------------------- Monthly Binary Variables ---------------------------------------------- ] [2004-2007 Monthly Binary Variables] s2 0.000013 (0.003645) 0.000013 (0.003652) 0.000013 (0.003606) 0.000013 (0.003591) 0.000016 (0.004035) c 10.120 11.070 4.590 3.890 1.800 0.430 -952.015 +/- 2.9% 0.271 -971.104 +/- 3.8% 0.710 -959.100 +/- 2.6% 0.793 -961.464 +/- 2.6% 0.937 -956.764 +/- 4.7% 2 2 P(>c ) AIC 95% Confidence Interval (2017) Standard Errors are reported in parantheses. * indicates significance at the 90% level. ** indicates significance at the 95% level. *** indicates significance at the 99% level. 25
32) Market Estimates July 2015 Low-Income Borrower Refinance Goal. Table 9 shows the four model specifications analyzed for the Low-Income Borrower Refinance Goal (LIR) plus the model used in the proposed rule, re-estimated using updated HMDA data. The Best Fit Model provides the best model for forecasting this goal. The AIC statistic for this specification is lowest, indicating it has the best goodness of fit. It is also among the best of the specifications in reducing white noise, as determined by the Chi Square statistic. Additional diagnostic information is provided in Appendix D. 26
33) Market Estimates July 2015 The best fitting equation was found to be a first differenced seasonal AR model with five autoregressive terms, with AR(1) and AR(5) being significant at the level of at least ten percent. In addition to the time series components, drivers of this housing goal include the log of the Core CPI month over month change lagged one month, the consumer confidence level (although the magnitude of its impact is minimal), the 10-Year Treasury yield lagged one month, log of median price of existing homes sold, log of FHFA’s HPI, log of total home sales, log of mortgage originations, FHA market share of refinance mortgages, share of ARMs lagged two months, the share of mortgages on owner-occupied properties and the refinance rate. The ChiSquare statistic indicates that the hypothesis that the residuals are white noise cannot be rejected. The forecasts for the Low-Income Borrower Refinance Goal are shown in Figure 4. While the SSF provides the best forecast, the forecast based on HMDA data alone is also shown. The SSF forecast averages 21.8, 22.4 and 22.8 percent in 2015 through 2017, respectively. The 2017 confidence interval is plus or minus 6.2 percent, which is smaller than the same interval for the model used in the proposed rule. Also, for reference, the figure is annotated with the 20102011 goal benchmark (21 percent) and the 2012-2014 benchmark (20 percent). 27
34) Market Estimates July 2015 Table 9 Low-Income Borrower Refinance Goal Full Model w/ 2004-07 -0.612 *** ( 0.115 ) Best Fit w/ 2004-07 -0.528 *** ( 0.111 ) Full Model -0.320 *** ( 0.119 ) Best Fit Model -0.335 *** ( 0.114 ) -0.258 ** ( 0.114 ) -0.260 ** ( 0.127 ) -0.030 ( 0.126 ) -0.052 ( 0.125 ) AR(3) -0.014 ( 0.126 ) 0.199 * ( 0.117 ) 0.185 ( 0.117 ) AR(4) -0.220 ** ( 0.112 ) -0.023 ( 0.119 ) -0.032 ( 0.118 ) 0.233 ** ( 0.111 ) 0.200 * ( 0.110 ) AR(1) AR(2) AR(5) Inflation Unemplment Rate 0.442 ( 0.288 ) 0.703 *** ( 0.240 ) Ln(Core CPIM/M) 0.994 * ( 0.550 ) 1.229 ** ( 0.544 ) Ln(Core CPIM/M)t-1 10-Year Treas. Yieldt-1 Interest Rates 0.000 ** ( 0.000 ) 0.000 *** ( 0.000 ) House Prices 0.000 ** ( 0.000 ) 0.000 ** ( 0.000 ) 1.203 *** ( 0.369 ) 1.642 *** ( 0.413 ) -0.564 ( 0.364 ) Rate Spread Ln(Med. Price, Exist. Homes) -1.289 ** ( 0.542 ) 1.186 *** ( 0.378 ) 0.941 ** ( 0.434 ) 30-Year Fixed Mort. Rate 0.245 ( 0.355 ) -1.265 ** ( 0.551 ) Consumer Confidence -0.260 ( 0.481 ) -0.956 * ( 0.552 ) 0.045 ( 0.036 ) Ln(HPI) -0.391 *** ( 0.122 ) -0.404 *** ( 0.120 ) Ln(HPIY/Y) -0.037 *** ( 0.014 ) -0.041 *** ( 0.012 ) Ln(Home Sales) Volume Model Used in Prop. Rule -0.312 *** ( 0.095 ) -0.054 *** ( 0.015 ) -0.052 *** ( 0.015 ) -0.016 *** ( 0.006 ) -0.015 *** ( 0.006 ) 0.155 *** ( 0.054 ) 0.159 *** ( 0.052 ) Ln(Mortgage Originations) -0.018 *** ( 0.006 ) -0.021 *** ( 0.006 ) FHA Share 0.085 * ( 0.050 ) ARM Sharet-2 0.071 * ( 0.038 ) 0.070 * ( 0.038 ) 0.107 *** ( 0.038 ) 0.108 *** ( 0.038 ) Owner-Occupied Share -0.878 *** ( 0.151 ) -0.873 *** ( 0.133 ) -0.726 *** ( 0.152 ) -0.748 *** ( 0.140 ) Refinance Rate -0.072 *** ( 0.023 ) -0.099 *** ( 0.020 ) -0.087 *** ( 0.025 ) -0.082 *** ( 0.024 ) -0.183 *** ( 0.022 ) [ ---------------------------------------------- Monthly Binary Variables ---------------------------------------------- ] [2004-2007 Monthly Binary Variables] s 2 0.000035 (0.005951) 0.000036 (0.005964) 0.000033 (0.005727) 0.000032 (0.005692) 0.000056 (0.007460) c2 4.010 1.500 0.270 0.430 2.720 2 0.404 -852.326 +/- 4.3% 0.472 -852.763 +/- 4.1% 0.602 -865.559 +/- 7.2% 0.511 -868.513 +/- 7.3% 0.744 -813.985 +/- 7.0% P(>c ) AIC 95% Confidence Interval (2017) Standard Errors are reported in parantheses. * indicates significance at the 90% level. ** indicates significance at the 95% level. *** indicates significance at the 99% level. 28
35) Market Estimates July 2015 29
36) Market Estimates July 2015 E. CONCLUSIONS FHFA is required to consider market size when establishing housing goals. This paper describes the methodologies used to estimate the affordable market size for the four singlefamily housing goals for 2015 through 2017. The 2015-2017 midpoint ranges, with overall ranges in brackets, of the affordable share of the prime, conforming conventional mortgage market for the four housing goals are: ï‚· Low-Income Borrower Home Purchase Goal 22 - 23 % [17 – 27 %] ï‚· Very Low-Income Borrower Home Purchase Goal 6% ï‚· Low-Income Areas Home Purchase Subgoal 13 - 14 % [11 – 18 %] ï‚· Low-Income Borrower Refinance Goal 22 - 23 % [17 – 29 %] [2 – 10 %] The market projections are based on econometric SSF time series models, incorporating industry and government economic, housing and mortgage market forecasts. 30
37) Market Estimates July 2015 Appendix A Low-Income Borrower Home Purchase Goal 31
38) Market Estimates July 2015 32
39) Market Estimates July 2015 33
40) Market Estimates July 2015 34
41) Market Estimates July 2015 35
42) Market Estimates July 2015 36
43) Market Estimates July 2015 Full Model w/ 2004-07 37
44) Market Estimates July 2015 Best Fit w/ 2004-07 38
45) Market Estimates July 2015 Full Model 39
46) Market Estimates July 2015 Best Fit Model 40
47) Market Estimates July 2015 Appendix B Very Low-Income Borrower Home Purchase Goal 41
48) Market Estimates July 2015 42
49) Market Estimates July 2015 43
50) Market Estimates July 2015 44
51) Market Estimates July 2015 45
52) Market Estimates July 2015 46
53) Market Estimates July 2015 Full Model w/ 2004-07 47
54) Market Estimates July 2015 Best Fit w/ 2004-07 48
55) Market Estimates July 2015 Full Model 49
56) Market Estimates July 2015 Best Fit Model 50
57) Market Estimates July 2015 Appendix C Low-Income Areas Home Purchase Subgoal 51
58) Market Estimates July 2015 52
59) Market Estimates July 2015 53
60) Market Estimates July 2015 54
61) Market Estimates July 2015 55
62) Market Estimates July 2015 56
63) Market Estimates July 2015 Full Model w/ 2004-07 57
64) Market Estimates July 2015 Best Fit w/ 2004-07 58
65) Market Estimates July 2015 Full Model 59
66) Market Estimates July 2015 Best Fit Model 60
67) Market Estimates July 2015 Appendix D Low-Income Borrower Refinance Goal 61
68) Market Estimates July 2015 62
69) Market Estimates July 2015 63
70) Market Estimates July 2015 64
71) Market Estimates July 2015 65
72) Market Estimates July 2015 66
73) Market Estimates July 2015 Full Model w/ 2004-07 67
74) Market Estimates July 2015 Best Fit w/ 2004-07 68
75) Market Estimates July 2015 Full Model 69
76) Market Estimates July 2015 Best Fit Model 70
77) Market Estimates July 2015 APPENDIX E Alternative HMDA Data Specifications The model that is used in setting the benchmark levels for the goals uses HMDA data starting in 2004 as the source for historical market statistics. FHFA’s forecasts for 2015-2017 do not use HMDA data prior to 2004 for several reasons. Data sources prior to 2004 are not available for explanatory variables that were found to be predictive in one or more of the models. Pre-2004 HMDA data did not identify property type, lien status, Home Ownership Equity Protection Act (HOEPA) status, and the Average Prime Offer Rate (APOR) rate spread. Pre-2004 HMDA data were also less precise in identifying manufactured housing loans and subprime loans. All of these differences make it difficult to use pre-2004 data to forecast goalqualifying shares for 2015-2017. FHFA did test model specifications that included monthly data going further back to January 1996, and this appendix includes a detailed description of that analysis. The results using pre-2004 data may be less reliable because either the confidence intervals are wider using the 1996-2013 data (as in the case of the single-family, low-income borrower home purchase goal and low-income areas subgoal), or the predicted trends do not coincide with what we have observed in recent months (in the case of the single-family, very low-income home purchase and low-income refinance goals) and the predicted trends resulting from the models using the shorter 2004-2013 time series are preferable. In 2004 the Federal Financial Institutions Examination Council (FFIEC) implemented a major change to HMDA data. Among the changes to the reporting requirements were the identification of manufactured housing loans, HOEPA identified loans, subordinate lien loans, and no lien loans. In addition, when the Annual Percentage Rate (APR) of a mortgage is greater 71
78) Market Estimates July 2015 than 300 basis points over the corresponding Treasury note rate, the spread between that APR and the note rate must be reported in the HMDA data (this was later amended to apply when the APR is greater than 150 basis points over the APOR for the week in which the mortgage rate was determined). The changes in HMDA data attributes are shown in Figure E.1. Prior to 2004, subprime loans were identified based on the lender that originated the loan. The Department of Housing and Urban Development (HUD) maintained a list of “Subprime Lenders.” Three issues materialized from this method: not all loans from lenders on the “Subprime Lender” list were subprime loans; not all subprime loans were originated by these lenders; and the possibility of miscategorization of lenders on the list. HOEPA, subordinate lien, and no lien loans were not identified in any form prior to 2004. Now that there are 10 years of this expanded HMDA data, FHFA has decided to base the mortgage affordability share forecasts on it, instead of the longer time series configured on a less 72
79) Market Estimates July 2015 Figure E.1 HMDA Data Used to Define the Market for the Single-Family Housing Goals a Manufactured Housing Loans3 Loans from Manufactured 1 Housing Lenders b 1996-2003 2004-2013 All Single-Family, Conventional, Conforming, Owner-Occupied, Home Purchase (Refinance) Loan Originations 4 HOEPA Loans3 c d Subordinate Liens / No Lien Loans3 e Loans from Subprime Lenders2 High-Cost Loans (Loans with reported APOR rate spread)3 f (Not to Scale) = Not included in Market Definition per 12 CFR 1282.12(b). = Impacts analyses only. a. Not all mfg. housing loans are originated by lenders on the "Mfg. Housing" List. b. Not all loans from lenders on the "Mfg. Housing" List are mfg. housing loans. c. HOEPA loans are goal accretive, but are not eligible for goal credit. (HOEPA loans that were originated by "subprime" lenders would have been removed as a result of that.) d. Subordinate/no lien loans are goals accretive. e. Some loans from lenders on the "Subprime" List are prime loans and included. f. Not all high-cost loans are originated by lenders on the "Subprime" List. High-cost is thought to be a better indicator of subprime than the "Subprime" list. (e and f are not equivalent in scale, nor composition.) 1 Based on annual List of "Manufactured Housing" Lenders, as developed by HUD, 1996-2004 (may erroneously identify some non-mfg. housing loans as mfg. housing). 2 Based on annual List of "Subprime" Lenders, as developed by HUD, 1996-2004 (may erroneously identify some prime loans as subprime). 3 Not identified in 1996-2003 HMDA data. 4 Where borrower incomes and geography information are not missing. 73
80) Market Estimates July 2015 precise definition. In this appendix, forecast models based on the longer (1996-2013) time series and the less precise definition of the market are explored. As in Section D, four models are presented for each housing goal. The Full Model includes all possible explanatory variables, whether they have a significant impact or not. For explanatory variable categories where there are several variables to choose from (e.g., the category of volume includes home sales, housing starts and mortgage originations), at least one variable will be included in the model specification and all variables with a significant impact will be included. In addition to all possible explanatory variables, the Full Model w/2004-07 includes a set of monthly binary variables for the years 2004 through 2007 to capture time specific effects of the mortgage boom period. The Best Fit Model includes explanatory variables that provide the best fit specification, as determined by significance of the variable, low model variance, minimizing white noise, and model goodness of fit.21 The Best Fit Model w/2004-07 is the best fit specification when the 2004 through 2007 binary monthly variables are included. In addition, for reference, the best fit model chosen in Section D is included as the final column in each table. Low-Income Borrower Home Purchase Goal. Table E.1 shows the four model specifications analyzed for the Low-Income Borrower Home Purchase Goal (LIP). The Best Fit Model is determined to provide the best model for forecasting this goal. The AIC statistic for this specification is lowest, indicating it has the best goodness of fit. The Best Fit Model w/20042007 specification does better in reducing white noise, as determined by the Chi Square statistic. The number of observations is almost doubled when using the extended data series, from 119 to 215, and the AIC statistic is much improved, while the model used to forecast market 21 In the following tables, white noise is minimized when the probability of a larger Chi Square statistic (i.e., P(>χ 2)) is highest. A better goodness of fit is determined by the lowest (most negative) Akaike Information Criterion (AIC) statistic. 74
81) Market Estimates July 2015 Table E.1 Low-Income Borrower Home Purchase Goal Best Fit w/ 2004-07 0.127 * ( 0.076 ) Full Model 0.099 ( 0.074 ) Best Fit Model 0.098 ( 0.073 ) New HMDA Def. Model -0.169 ( 0.105 ) AR(2) -0.021 ( 0.076 ) 0.003 ( 0.074 ) -0.007 ( 0.072 ) 0.256 ** ( 0.108 ) AR(3) -0.071 ( 0.076 ) -0.164 ** ( 0.075 ) -0.157 ** ( 0.072 ) -0.021 ( 0.108 ) AR(4) -0.098 ( 0.077 ) AR(5) 0.062 ( 0.076 ) AR(6) 0.141 * ( 0.076 ) AR(1) Unemplment Ratet-1 Full Model w/ 2004-07 0.132 * ( 0.076 ) 0.584 ** ( 0.254 ) -0.231 ** ( 0.105 ) 0.539 ** ( 0.249 ) Ln(Core CPIY/Y) Interest Rates 10-Year Treas. Yieldt-1 -0.212 *** ( 0.059 ) -0.208 *** ( 0.060 ) -0.212 ( 0.180 ) 0.717 *** ( 0.231 ) 0.836 ** ( 0.389 ) Ln(Core CPIM/M) 0.607 ** ( 0.243 ) 0.815 ** ( 0.383 ) -0.202 *** ( 0.050 ) -0.199 *** ( 0.049 ) -0.007 ( 0.200 ) -0.646 ** ( 0.295 ) -0.205 ( 0.361 ) -0.438 ( 0.353 ) House Prices Ln(Med. Price, Exist. Homes) Ln(HPI)t-1 -0.177 *** ( 0.047 ) 0.111 ( 0.078 ) 0.125 * ( 0.071 ) Ln(HAI) Volume Ln(Home Sales) 0.026 ( 0.024 ) -0.068 * ( 0.040 ) 0.027 ** ( 0.013 ) 0.020 ( 0.013 ) 0.035 * ( 0.020 ) 0.027 ** ( 0.013 ) 0.042 *** ( 0.014 ) Ln(Housing Starts) 0.011 ** ( 0.006 ) Ln(Mortgage Originations) FHA Share ARM Sharet-3 Owner-Occupied Share -0.146 ** ( 0.060 ) -0.628 ** ( 0.253 ) 30-Year Fixed Mort. Rate Rate Spread 0.464 * ( 0.264 ) 0.005 * ( 0.003 ) 0.107 ** ( 0.049 ) 0.101 ** ( 0.045 ) 0.044 ( 0.046 ) 0.005 ( 0.018 ) 0.000 *** ( 0.000 ) -0.008 ( 0.017 ) 0.311 *** ( 0.112 ) 0.324 *** ( 0.098 ) 0.368 *** ( 0.108 ) -0.095 *** ( 0.032 ) 0.406 *** ( 0.095 ) 0.570 *** ( 0.105 ) [ ---------------------------------------------- Monthly Binary Variables ---------------------------------------------- ] [2004-2007 Monthly Binary Variables] s 2 0.000029 (0.005354) 0.000028 (0.005300) 0.000029 (0.005407) 0.000029 (0.005379) 0.000021 (0.004596) c 2 25.890 13.080 17.880 18.470 3.640 0.007 -1607.740 215 +/- 7.8% 0.042 -1611.870 215 +/- 7.7% 0.037 -1610.980 215 +/- 6.6% 0.030 -1617.600 215 +/- 6.5% 0.888 -920.310 119 +/- 5.2% 2 P(>c ) AIC Number of Observations 95% Confidence Interval (2017) Standard Errors are reported in parantheses. * indicates significance at the 90% level. ** indicates significance at the 95% level. *** indicates significance at the 99% level. 75
82) Market Estimates July 2015 performance for the LIP goal does better at reducing white noise and has narrower confidence intervals. As can be seen in Figure E.2, the two data series track each other closely and the forecasts are similar. The forecast based on the extended time series does pick up the seasonality characteristics evident in the pre-2000 data. Very Low-Income Borrower Home Purchase Goal. Table E.2 shows the four model specifications analyzed for the Very Low-Income Borrower Home Purchase Goal (VLIP). 76
83) Market Estimates July 2015 Table E.2 Very Low-Income Borrower Home Purchase Goal Full Model w/ 2004-07 0.181 ** ( 0.077 ) Best Fit w/ 2004-07 0.188 ** ( 0.076 ) Full Model 0.141 * ( 0.072 ) Best Fit Model 0.147 ** ( 0.071 ) AR(2) -0.021 ( 0.077 ) -0.010 ( 0.077 ) -0.015 ( 0.073 ) -0.039 ( 0.072 ) AR(3) -0.189 ** ( 0.076 ) -0.191 ** ( 0.077 ) -0.226 *** ( 0.073 ) -0.244 *** ( 0.072 ) AR(1) AR(4) 0.062 ( 0.077 ) AR(6) 0.128 * ( 0.076 ) Unemplment Ratet-1 0.225 ** ( 0.101 ) 0.249 ** ( 0.100 ) 0.265 ** ( 0.105 ) 0.289 *** ( 0.099 ) Ln(Core CPIM/M) 0.377 ** ( 0.173 ) 0.389 ** ( 0.174 ) 0.453 *** ( 0.169 ) 0.482 *** ( 0.162 ) Ln(Core CPIY/Y) -0.079 *** ( 0.024 ) -0.076 *** ( 0.026 ) -0.079 *** ( 0.022 ) -0.074 *** ( 0.021 ) Consumer Confidencet-3 0.000 * ( 0.000 ) Interest Rates -0.106 *** ( 0.030 ) -0.238 *** ( 0.083 ) 10-Year Treas. Yieldt-1 -0.034 ( 0.078 ) 10-Year Treas. Yieldt-2 -0.096 ( 0.073 ) 30-Year Fixed Mort. Rate -0.086 ( 0.089 ) 0.000 *** ( 0.000 ) Rate Spread -0.119 ( 0.149 ) Ln(Med. Price, Exist. Homes) House Prices 0.283 ** ( 0.125 ) 0.000 ** ( 0.000 ) 10-Year Treas. Yield Ln(HPI)t-1 -0.034 *** ( 0.012 ) -0.056 * ( 0.032 ) -0.072 ** ( 0.032 ) -0.075 ** ( 0.032 ) Ln(HAI)t-1 Ln(Home Sales) Volume 0.305 *** ( 0.100 ) -0.052 ( 0.078 ) AR(5) New HMDA Def. Model -0.001 ( 0.101 ) -0.063 ** ( 0.029 ) 0.017 ** ( 0.009 ) 0.009 ( 0.006 ) 0.011 ** ( 0.005 ) 0.012 ** ( 0.006 ) 0.015 *** ( 0.005 ) Ln(Mortgage Originations)t-2 0.027 *** ( 0.005 ) -0.003 * ( 0.002 ) FHA Share 0.012 ( 0.021 ) -0.007 ( 0.021 ) ARM Sharet-3 -0.003 ( 0.007 ) -0.002 ( 0.007 ) Owner-Occupied Share 0.028 ( 0.047 ) 0.063 ( 0.047 ) [ ---------------------------------------------- Monthly Binary Variables ---------------------------------------------- ] [2004-2007 Monthly Binary Variables] s 2 0.000005 (0.002253) 0.000005 (0.002250) 0.000006 (0.002368) 0.000006 (0.002352) 0.000004 (0.002016) c 2 18.040 17.100 19.640 24.830 21.160 0.035 -1977.370 215 +/- 2.9% 0.009 -1980.140 215 +/- 3.4% 0.020 -1965.840 215 +/- 2.9% 0.003 -1973.190 215 +/- 2.8% 0.020 -1122.010 119 +/- 3.8% 2 P(>c ) AIC Number of Observations 95% Confidence Interval (2017) Standard Errors are reported in parantheses. * indicates significance at the 90% level. ** indicates significance at the 95% level. *** indicates significance at the 99% level. 77
84) Market Estimates July 2015 The Best Fit Model w/2004-2007 Monthly Binary Variables is determined to provide the best model for forecasting this goal. The AIC statistic for this specification is lowest, indicating it has the best goodness of fit. The Full Model w/2004-2007 specification does better in reducing white noise, as determined by the Chi Square statistic. The number of observations is almost doubled when using the extended data series, from 119 to 215, the AIC statistic is much improved, while the full models and the model used to forecast market performance for the VLIP goal do better at reducing white noise. The confidence interval is slightly smaller than the interval produced by the model used for the forecast. As can be seen in Figure E.3, the two data series track each other closely. The forecast based on the extended time series has a distinct positive slope, while the forecast based on the new HMDA specification is flatter. As with the LIP series, the forecast from the extended series picks up the seasonality characteristics evident in the pre-2000 data. 78
85) Market Estimates July 2015 Low-Income Areas Home Purchase Subgoal. Table E.3 shows the four model specifications analyzed for the Low-Income Areas Home Purchase Subgoal (LAP). The Best Fit Model is determined to provide the best model for forecasting this goal. The AIC statistic for this specification is lowest, indicating it has the best goodness of fit. This model specification does as well as the other models when it comes to reducing white noise, as determined by the Chi Square statistic. The number of observations is almost doubled when using the extended data series, from 117 to 215, the AIC statistic is much improved, and this model does better at reducing white noise than the model used to forecast market performance 79
86) Market Estimates July 2015 Table E.3 Low-Income Areas Home Purchase Subgoal Full Model -0.042 ( 0.075 ) Best Fit Model -0.075 ( 0.073 ) New HMDA Def. Model -0.087 ( 0.106 ) AR(2) -0.100 ( 0.075 ) -0.062 ( 0.073 ) -0.226 ** ( 0.108 ) AR(3) 0.079 ( 0.075 ) 0.118 ( 0.074 ) 0.191 * ( 0.116 ) AR(4) -0.117 ( 0.075 ) -0.335 ** ( 0.170 ) -0.375 ** ( 0.169 ) -0.491 ** ( 0.200 ) 0.089 *** ( 0.033 ) 0.093 *** ( 0.034 ) AR(1) Unemplment Rate Full Model w/ 2004-07 -0.069 ( 0.078 ) Best Fit w/ 2004-07 -0.072 ( 0.073 ) -0.439 ** ( 0.175 ) Ln(Core CPIY/Y) Ln(Core CPIY/Y)t-3 0.048 ( 0.041 ) 0.100 * ( 0.054 ) Consumer Confidencet-1 0.000 * ( 0.000 ) 0.000 ( 0.000 ) 0.000 ( 0.000 ) 10-Year Treas. Yield Interest Rates Consumer Confidencet-3 0.223 ( 0.238 ) -0.096 ( 0.142 ) 30-Year Fixed Mort. Rate -0.569 * ( 0.322 ) 30-Year Fixed Mort. Ratet-1 0.445 ** ( 0.210 ) Rate Spread -0.216 ( 0.280 ) -0.064 ** ( 0.027 ) Ln(HPI) House Prices Ln(Med. Price, Exist. Homes) -0.190 ** ( 0.085 ) -0.214 *** ( 0.068 ) 0.025 *** ( 0.009 ) 0.028 *** ( 0.008 ) Ln(HPIY/Y) Ln(HAI) Volume -0.032 ** ( 0.014 ) -0.038 *** ( 0.014 ) 0.016 * ( 0.009 ) 0.016 * ( 0.009 ) 0.011 *** ( 0.004 ) -0.041 *** ( 0.014 ) 0.014 ( 0.010 ) Ln(Housing Starts)t-2 FHA Share -0.053 *** ( 0.018 ) 0.011 *** ( 0.004 ) -0.058 ** ( 0.025 ) -0.040 * ( 0.023 ) Ln(HAI)t-2 Ln(Home Sales) -0.051 *** ( 0.018 ) 0.008 ** ( 0.004 ) -0.042 ( 0.036 ) FHA Sharet-1 -0.041 ( 0.026 ) ARM Share 0.022 * ( 0.013 ) 0.019 ( 0.013 ) Owner-Occupied Share 0.066 ( 0.084 ) -0.110 * ( 0.065 ) -0.120 * ( 0.065 ) [ ---------------------------------------------- Monthly Binary Variables ---------------------------------------------- ] [2004-2007 Monthly Binary Variables] ------------------- s 2 0.000014 (0.003763) 0.000014 (0.003794) 0.000014 (0.003676) 0.000014 (0.003686) 0.000014 (0.003704) c 2 12.510 6.510 5.340 5.310 10.440 0.326 -1757.000 215 +/- 4.1% 0.837 -1761.710 215 +/- 4.1% 0.721 -1775.130 215 +/- 3.7% 0.806 -1779.230 215 +/- 4.2% 0.316 -951.131 117 +/- 3.8% 2 P(>c ) AIC Number of Observations 95% Confidence Interval (2017) Standard Errors are reported in parantheses. * indicates significance at the 90% level. ** indicates significance at the 95% level. *** indicates significance at the 99% level. 80
87) Market Estimates July 2015 for the LAP subgoal. However, the confidence interval is slightly larger than the interval produced by the model used for the forecast. As can be seen in Figure E.4, except for a brief period during the housing bubble, the two data series track each other closely and the forecasts are similar. Low-Income Borrower Refinance Goal. Table E.4 shows the four model specifications analyzed for the Low-Income Borrower Refinance Goal (LIR). The Best Fit Model w/20042007 Monthly Binary Variables is determined to provide the best model for 81
88) Market Estimates July 2015 Table E.4 Low-Income Borrower Refinance Goal Full Model -0.191 ** ( 0.075 ) Best Fit Model -0.177 ** ( 0.073 ) AR(2) 0.008 ( 0.078 ) 0.000 ( 0.076 ) -0.052 ( 0.125 ) AR(3) 0.156 ** ( 0.074 ) 0.144 ** ( 0.073 ) 0.185 ( 0.117 ) AR(1) Full Model w/ 2004-07 -0.270 *** ( 0.074 ) Best Fit w/ 2004-07 -0.261 *** ( 0.073 ) New HMDA Def. Model -0.335 *** ( 0.114 ) AR(4) -0.032 ( 0.118 ) AR(5) 0.200 * ( 0.110 ) Unemplment Ratet-1 -0.622 ** ( 0.274 ) -0.625 ** ( 0.271 ) -0.631 ** ( 0.297 ) -0.544 * ( 0.293 ) Ln(Core CPIM/M)t-1 Ln(Core CPIM/M)t-3 -1.289 ** ( 0.542 ) 0.376 ( 0.411 ) 0.242 ( 0.405 ) 0.000 ** ( 0.000 ) 0.000 ** ( 0.000 ) 0.000 ** ( 0.000 ) 0.000 ** ( 0.000 ) 0.704 ** ( 0.307 ) 0.778 *** ( 0.263 ) 0.596 * ( 0.322 ) 0.685 ** ( 0.273 ) 1.203 *** ( 0.369 ) Interest Rates 0.000 ** ( 0.000 ) 10-Year Treas. Yieldt-1 House Prices Consumer Confidence Ln(HPI)t-1 0.321 *** ( 0.114 ) 0.307 *** ( 0.111 ) 0.320 *** ( 0.118 ) 0.285 ** ( 0.112 ) 0.404 *** ( 0.120 ) Ln(HPIY/Y) -0.029 ** ( 0.013 ) -0.026 ** ( 0.012 ) -0.038 *** ( 0.013 ) -0.036 *** ( 0.013 ) -0.041 *** ( 0.012 ) Rate Spreadt-1 -0.226 ( 0.445 ) -0.302 ( 0.458 ) Volume Ln(Home Sales) Ln(Home Sales)t-2 -0.052 *** ( 0.015 ) -0.027 * ( 0.014 ) -0.028 ** ( 0.014 ) -0.017 ( 0.013 ) Ln(Mortgage Originations) -0.015 *** ( 0.006 ) FHA Share 0.159 *** ( 0.052 ) FHA Sharet-2 0.133 *** ( 0.046 ) ARM Sharet-2 0.031 ( 0.020 ) Owner-Occupied Share -0.395 *** ( 0.111 ) 0.141 *** ( 0.046 ) 0.097 ** ( 0.045 ) 0.039 * ( 0.021 ) -0.396 *** ( 0.111 ) 0.115 ** ( 0.048 ) 0.039 * ( 0.021 ) 0.108 *** ( 0.038 ) -0.445 *** ( 0.116 ) -0.438 *** ( 0.115 ) -0.748 *** ( 0.140 ) [ ---------------------------------------------- Monthly Binary Variables ---------------------------------------------- ] [2004-2007 Monthly Binary Variables] s2 0.000037 (0.006084) 0.000037 (0.006084) 0.000040 (0.006294) 0.000039 (0.006284) 0.000032 (0.005692) c2 13.820 14.890 14.380 13.990 0.430 0.243 -1551.110 215 +/- 5.7% 0.188 -1553.480 215 +/- 5.7% 0.110 -1544.770 215 +/- 7.1% 0.123 -1548.050 215 +/- 7.0% 0.511 -868.513 119 +/- 7.3% P(>c2 ) AIC Number of Observations 95% Confidence Interval (2017) Standard Errors are reported in parantheses. * indicates significance at the 90% level. ** indicates significance at the 95% level. *** indicates significance at the 99% level. 82
89) Market Estimates July 2015 forecasting this goal. The AIC statistic for this specification is lowest, indicating it has the best goodness of fit. It also does reasonably well in reducing white noise, as determined by the Chi Square statistic. The number of observations is almost doubled when using the extended data series, from 119 to 215, the AIC statistic is much improved, while the model used to forecast market performance for the LIR goal does better at reducing white noise. This model/data specification does result in narrower confidence intervals. As can be seen in Figure E.5, except for a brief period during the housing bubble, the two data series track each other closely. The forecast based on the extended time series has a distinct positive slope, while the forecast based on the new HMDA specification is flatter. 83
90) Market Estimates July 2015 Summary The additional data points from using a longer time series improve many of the regression statistics, especially the goodness of fit statistics. However, the regression statistics and resulting forecasts from the shorter time series are reasonable, and the shorter time series data are based on a more precisely defined market. A summary of the forecasts for the longer (1996-2013) time series and the shorter (2004-2013) time series is provided in Table E.5. 84
91) Market Estimates July 2015 Table E.5 ACTUAL HMDA MARKET PERFORMANCE AND PROJECTED MARKET Low -Incom e Borrow er Hom e Purchase Share 2008 2009 2010 2011 2012 2013 2014 2015 2016 2017 Actual Market 25.3% 29.6% 27.2% 26.5% 26.6% 24.0% Proposed Rule 23.4% 21.4% 20.9% 20.2% 19.8% +/- 3.0 +/- 5.2 +/- 6.7 +/- 7.9 +/- 9.0 HMDA Data (1996- ) 23.1% 22.4% 21.9% 21.5% +/-2.3 HMDA Data (2004- ) +/-3.8 +/-5.2 +/-6.3 22.0% 22.4% 22.9% 22.0% +/- 2.0 +/- 3.2 +/- 4.2 +/- 5.0 Very Low -Incom e Borrow er Hom e Purchase Share 2008 Actual Market 6.5% 2009 8.8% 2010 8.1% 2011 8.0% 2012 7.7% Proposed Rule 2013 2014 2015 2016 2017 6.3% 6.5% 5.7% 5.8% 5.7% 5.6% +/- 1.0 +/- 1.4 +/- 2.5 +/- 3.2 +/- 3.8 HMDA Data (1996- ) 6.5% 6.8% 6.9% +/-2.2 +/-2.9 +/-3.3 5.7% HMDA Data (2004- ) 6.5% +/-1.3 5.9% 6.0% 5.7% +/- 1.4 +/- 2.5 +/- 3.2 +/- 3.8 Low -Incom e Area Hom e Purchase Share 2008 2009 2010 2011 2012 2013 2014 2015 2016 2017 Actual Market 14.1% 13.0% 12.1% 11.4% 13.6% 14.2% Proposed Rule 13.4% 14.3% 14.7% 14.7% 14.2% +/- 1.6 +/- 2.9 +/- 4.1 +/- 5.1 +/- 5.9 HMDA Data (1996- ) 14.0% 12.9% 14.0% 14.9% +/-0.5 HMDA Data (2004- ) +/-1.6 +/-3 +/-3.9 14.0% 13.2% 13.6% 14.2% +/- 0.6 +/- 1.5 +/- 2.8 +/- 3.6 Low -Incom e Borrow er Refinance Share 2008 2009 2010 2011 2012 2013 2014 2015 2016 2017 Actual Market 23.4% 20.8% 20.2% 21.5% 22.3% 24.3% Proposed Rule 22.4% 27.6% 31.0% 33.5% 34.2% +/- 3.3 +/- 5.3 +/- 6.8 +/- 8.1 +/- 9.1 HMDA Data (1996- ) 26.5% 23.3% 26.2% 28.8% +/- 1.5 +/- 2.6 +/- 4.2 +/- 5.4 HMDA Data (2004- ) 26.2% 21.8% 22.4% 22.8% +/- 1.5 +/- 2.7 +/- 4.7 +/- 6.2 85
92) Market Estimates July 2015 APPENDIX F Data Sources Federal Financial Institutions Examination Council, Home Mortgage Disclosure Act Data Low-Income Borrower Home Purchase Mortgage Share Very Low-Income Borrower Home Purchase Mortgage Share Low-Income Area Home Purchase Mortgage Share Low-Income Borrower Refinance Mortgage Share Refinance Mortgage Share, 2004 - 2013 FHA Home Purchase Mortgage Market Share, 2004 - 2013 Investor Share http://www.ffiec.gov/hmda/default.htm Federal Housing Finance Agency House Price Index http://www.fhfa.gov/DataTools/Downloads/Pages/House-Price-Index.aspx U.S. Department of Commerce, Bureau of Economic Analysis Gross Domestic Product http://www.bea.gov/ U.S. Department of Commerce, Census Bureau Housing Starts http://www.census.gov/construction/nrc/historical_data/ New Home Sales Median and Sales Price of New One-Family Houses Sold http://www.census.gov/construction/nrs/historical_data/ U.S. Department of Housing and Urban Development FHA Production Reports http://portal.hud.gov/hudportal/HUD?src=/program_offices/housing/hsgrroom/fhaprodrpt U.S. Department of Labor, Bureau of Labor Statistics Consumer Price Index http://www.bls.gov/cpi/data.htm Unemployment Rate http://www.bls.gov/cps/ 86
93) Market Estimates July 2015 Federal Reserve Bank of St. Louis Monthly average of the 10-Year Treasury Constant Maturity Rate Monthly average of the 1-Year Treasury Constant Maturity Rate http://research.stlouisfed.org/fred2/categories/115 Mortgage Bankers Association Single-Family Originations Refinance Mortgage Share, 2014 Q1 – 2014 Q3 Forecast http://www.mortgagebankers.org/ResearchAndForecasts/ForecastsAndCommentary Freddie Mac Monthly average of the 30-Year Fixed Rate Mortgage Rate Monthly average of the 5-Year Adjustable Rate Mortgage Rate Monthly average of the 1-Year Adjustable Rate Mortgage Rate http://www.freddiemac.com/pmms/release.html Forecast http://www.freddiemac.com/finance/ehforecast.html Fannie Mae Forecast http://www.fanniemae.com/portal/research-and-analysis/emma.html National Association of Realtors Monthly Housing Affordability Index http://www.realtor.org/topics/housing-affordability-index Existing-Home Sales Median Sales Price - Existing-Homes http://www.realtor.org/topics/existing-home-sales Forecast http://www.realtor.org/research-and-statistics Wells Fargo Forecast https://www.wellsfargo.com/com/insights/economics/monthly-outlook PNC Financial Forecast https://www.pnc.com/webapp/unsec/NCAboutMicrositeNav.do?siteArea=/pnccorp/PNC/ Home/About+PNC/Media+Room/Economic+Reports 87
94) Market Estimates July 2015 National Association of Home Builders Forecast http://www.nahb.org/reference_list.aspx?sectionID=138 Standard and Poor’s S&P/Case-Shiller Home Price Indices http://www.spindices.com/index-family/real-estate/sp-case-shiller Forecast http://www.standardandpoors.com/en_US/web/guest/home Wall Street Journal Survey Forecast http://projects.wsj.com/econforecast The Conference Board Forecast http://www.conference-board.org/data/chiefeconomist.cfm Federal Reserve Board of Governors, Federal Open Market Committee Forecast http://www.federalreserve.gov/monetarypolicy/fomccalendars.htm Raymond James Financial Forecast http://raymondjames.com/monit2.htm Trading Economics Forecast http://www.tradingeconomics.com/united-states/forecast Federal Reserve Bank of Philadelphia Community Outlook Survey http://www.philadelphiafed.org/community-development/community-outlook-survey/ Forecast http://www.philadelphiafed.org/research-and-data/real-time-center/survey-ofprofessional-forecasters/ 88