Severity: Notice
Message: Undefined variable: content_category
Filename: user/transcript.php
Line Number: 106
Severity: Warning
Message: Invalid argument supplied for foreach()
Filename: user/transcript.php
Line Number: 106


1) U.S. Equity Indices | November 2015 KEY HIGHLIGHTS • • • • The S&P 500® increased 0.05% in November, bringing its YTD return to 1.04%. The Dow Jones Industrial Average® returned 0.32% this month but was off 0.58% YTD. The S&P MidCap 400® was up 1.18% for the month and 0.65% YTD. The S&P SmallCap 600® returned 2.52% in November, bringing its YTD return to 1.68%. Exhibit 1: Index Returns Index 1-Month (%) YTD (%) 1-Year (%) S&P 500 0.05 1.04 0.62 Dow Jones Industrial Average 0.32 -0.58 -0.61 S&P MidCap 400 1.18 0.65 1.33 S&P SmallCap 600 2.52 1.68 4.42 Source: S&P Dow Jones Indices LLC. Data as of Nov. 30, 2015. Past performance is no guarantee of future results. Table is provided for illustrative purposes. Returns shown are price returns. MARKET SNAPSHOT Quarter point, quarter point, quarter point onward, into the valley of bears rode the mighty S&P 500, as a rate increase of 0.25% in December became the battle cry, even as the youngest of them had traded not for the last (June 2006). Pessimistic retail predictions to the left (more for bricks than clicks), dwindling oil demand and prices to the right, and short-sellers (and their reports) to the front, as they forwarded into the jaws of margin (especially China and IPOs). Right through the line they broke; fear not a terrorist; fear not budgetary deficits; and fear not a congressional or anti-trust committee, or any reversal of inversions. Back from the mouth of correction, onto the December gains (which, historically, is up 73.6% of the time); “When can their short-term glory fade?” (and short covering commence), all the world wondered. Contributor: Howard Silverblatt, Index Investment Strategy, Senior Industry Analyst, howard.silverblatt@spdji.com S&P Dow Jones Indices’ Market Attributes series provides market commentary highlighting developments across various asset classes.
2) Market Attributes | U.S. Equities November 2015 Tragic events were many, but onward the mighty S&P 500 rode. The attacks in Paris left 130 dead and hundreds injured, as it sparked an air strike in Syria, police raids in multiple cities, heightened security globally, and set the stage for a potential coalition of nations not seen since the World Wars. The downing of a Russian military aircraft by Turkey (the first time a NATO member has shot down a Russian warplane since 1952) pushed oil up, but only to the low USD 40s, as words more than deeds were the reaction. In the U.S., investors digested the bird known as Thanksgiving, along with the Fed and lots of economic data, which was mostly positive. Among the easily digested was the continuation of M&A. Not as easy to stomach were brick-and-mortar retail stores, which initially had lower-thanexpected traffic reports, even as stores were jammed with Black Friday bargain hunters. Web-based sales (at least pure web-based issues, not brick-and-mortar “new and improved” websites), however, appeared to be busy, as Thursday, Thanksgiving Day, saw strong online sales, and the terms “cyber Friday” and “cyber Saturday” appeared. While that had the potential to leave cyber Monday sales lower, there seemed little fear of overall web-based sales falling short. So as shoppers turn in their winter coats and snow boots for homemade lattes and easy clicks, the “bring it on” macho slogan from market participants will be tested by actual sales, fund reallocations, and the traditional window dressing that comes after Christmas. In economic news, Japan slipped back into a recession, as it posted its second GDP contraction (off 0.8% for Q3 2015 and off 0.7% for Q2 2015). Eurozone inflation for October came in positive, up 0.1%, and core inflation was at an annual rate of 1.1%. The October Eurozone Markit Purchasing Managers' Index came in at 54.4, up from last month’s 53.9, its highest level since May 2011. China’s official 7.0% growth prediction fell to 6.5%, as Chinese exports declined 6.9% year-over-year in October, with imports declining 18.8%; China’s trade surplus still stands at USD 61.6 billion. The Chinese government said it would increase stock margin requirements, going from putting up one and being able to borrow one, to having to put up two to borrow one. In the U.S., the month started with a big beat from the employment report, which made an interest rate increase in December a possibility. The report posted 271,000 net new jobs for October when a significantly lower rate of 180,000 was expected; the unemployment rate fell to 5.0% when it was expected to be flat at 5.1%, which was the lowest rate since April 2008. Hourly wages came in much higher, up 0.4%, when a 0.2% gain was expected. The FOMC notes showed that the Fed was ready to increase interest rates in December, and the new term “lift off” came into the vocabulary. The second report on third quarter GDP posted a 2.1% annual rate, which was up from the prior 1.5% release. Prices still showed signs of sub-2% inflation, but core was closer to the mark, as the October PPI came in with a year-over-year change of -1.6%, and the ex-food and energy component posted a gain of 0.1%. The PCE Chain Price for October was up 0.2% year-over-year, as the core price was up 1.3% year-over-year. With a sharp reversal from last month’s 0.8% decline, the October Durable Orders Report came in with a 3.0% gain, when a much lower 1.8% gain was expected; the report was still down 4.2% YTD. The October Consumer Confidence Report disappointed, coming in at 90.4 when a much higher 99.6 was expected, but it did not do much damage to the market. Housing news was mixed, as slower growth continued, but the overall housing market still posted growth. The October Existing Home Sales posted a 3.4% monthly decline but was up 3.9% year-over-year, as the S&P/Case-Shiller 20-City Composite Home Price Index posted a 5.5% gain year-over-year for September. Housing Starts declined 11%, as multi-units declined 25% (after several large increases), while Housing Permits, which are forward looking, increased 4.1% to their highest level since December 2007. New Home Sales increased 10.7% for the month, and Pending Home Sales came in as expected—up 0.1%. The September FHFA Home Price report posted a 0.8% monthly gain, which was twice the expected 0.4% gain, pushing the year-over-year gain to 5.7%. It was an especially good month, again, for M&A as the deals just kept coming. U.K. biopharmaceutical issue Shire PLC (SHPG; off 8.2% for the month) said it would buy disease specialty issue Dyax (DYAX; 2
3) Market Attributes | U.S. Equities November 2015 up 22.3% for the month) for USD 5.9 billion, with Shire reportedly ready to make another offer for biopharmaceutical issue Baxalta (BXLT; up 0.2% for the month). Video game maker Activision Blizzard (ATVI; up 8.3% for the month) said it would buy digital game maker King Digital Entertainment (KING; up 18.2% for the month) for USD 5.9 billion. Timber products issue Weyerhaeuser (WY; up 9.7% for the month) said it would buy competitor Plum Creek Timber (PCL; up 24.7% for the month) for USD 7 billion. Air Liquide (AIQUY; off 6.2% for the month) said it would buy industrial chemical and gas issue Airgas (ARG; up 43.7% for the month) for a deal estimated at USD 13.4 billion. Hotel and resort owner Marriott International (MAR; off 7.6% for the month) said it would buy competitor Starwood Hotel & Resorts (HOT; off 10.1% for the month) for USD 12.2 billion in stock. Liberty Global (LBTYA; off 4.7% for the month) said it would buy the Caribbean cable operations from Cable & Wireless for USD 5.3 billion. U.S. ATM maker Diebold (DBD; off 6.0% for the month) made a USD 1.8 billion bid for German competitor WINCOR NIXDORF (WNXDF). CVC Capital Partners was reported in the papers as making a private deal to buy pet supplies and product maker Petco Holdings for USD 4.5 billion from TPG; earlier reports had said TPG was exploring an IPO for Petco. In the “maybe, rumored, and dead” column was oil and gas explorer Apache (APA; up 4.3% for the month), which said it received interest in a takeover from Anadarko Petroleum (APC; off 10.4% for the month). Railroad holding issue Norfolk Southern (NSC; up 18.8% for the month) was rumored to be a target for Canadian Pacific Railway (CP; up 5.0% for the month). Mylan NV’s (MYL; up 16.4% for the month) hostile USD 26 billion offer for Perrigo (PRGO; off 5.3% for the month) was apparently taken off the table when only 40% of Perrigo’s holders tendered their shares to Mylan. In the “no deal” category, Ericsson (ERIC; off 0.5% for the week) said there had been no talks with Cisco Systems (CSCO; off 5.5% for the week) about a merger, as rumors circulated after the joint venture deal, which the companies denied. Activist investors remained in the news, as new disclosures showed that Carl Icahn held 7.1% of copier and duplicator system maker Xerox (XRX), Pershing Square held 9.9% of biopharmaceutical seller Valeant Pharmaceutical (VRX), and Elliott Management held 6.4% of aluminum producer Alcoa (AA). The deal of the month was from healthcare and specialty chemical maker Pfizer (PFE; off 3.1% for the month), which said it would buy off-patent medication maker Allergan (AGN; up 1.8% for the month) in a share deal with a potential value of over USD 155 billion. The deal would see Pfizer headquarter in Ireland, where it could potentially save USD 2 billion in taxes. This set off a significant amount of political rhetoric on taxes, but, given the complexity and time needed to change tax policy, change was not expected to be seen anytime soon. IPOs were busy, as long-awaited electronic payment service issue Square (SQ) did its IPO at an official offering price of USD 9, when its initial offering range was USD 11-13, while its more-recent private offer was at USD 15.46; the shares closed the month at USD 12.04, up 33.8%. Dating service Match Group (MTCH) also did its IPO, at USD 12, and closed the month at USD 14.48, up 20.7%. Together, the two painted a picture of investor appetite for IPO issues, but investors seemed to be eyeing the prices (and values) with more scrutiny. In other news, conservative Mauricio Macri (the mayor of Buenos Aires) was elected President of Argentina, defeating liberal Daniel Scioli; the election centered on the Argentine economy. Chinese and Taiwanese leaders met for the first time in 70 years. The Trans-Canada Keystone XL Pipeline was rejected by the U.S. government, ending a seven-year effort to get permission to build it. Turkey shot down a Russian fighter jet it said was over its airspace after 10 warnings (in a five-minute span). The incident pushed markets (both open and futures) down, but oil prices moved up, as facts and information were still being disseminated. Russian President Putin said the incident was a "stab in the back” that will have “serious consequences” for Russia's relationship with Turkey. Chinese stocks dropped quickly after authorities announced investigations into potential trading violations; the immediate impact was that the Shanghai declined over 5%, and some issues, such as Citic Securities (China’s largest broker), declined the daily limit of 10%. Of current and future note was UnitedHealth 3
4) Market Attributes | U.S. Equities November 2015 Group (UNH; off 4.3% for the month), the largest U.S.-managed health maintenance service, which cut its forecast, as it cited losses from the Affordable Care Act’s healthcare exchanges (Obamacare) and said it was evaluating its involvement with the program. Recent 2016 sign-up medical programs and reports have spoken to the lack of profitability of current plans for companies, as well as the higher cost and lower coverage for individuals. On an issue level, Volkswagen continued to struggle and address its emission issue, as both units were affected and costs increased. Generic drug seller Valeant Pharmaceutical International (VRX) fell 4.1% for the month, as concerns continued over an investigation of its practices. Japan’s SoftBank missed earnings expectations, as it said it would cut thousands of jobs. Alibaba (BABA) booked USD 14.3 billion in gross sales for Chinese Single’s Day, and it posted a 0.3% gain for the month. Retail was mixed, as earnings, sales, and forecast misses hurt department store Macy's (M; off 23.3% for the month), upscale apparel store Nordstrom (JWN; off 13.6% for the month), and watch and fashion issue Fossil Group (FOSL; off 29.3% for the month), while the brick-to-click purchases continued to help webbased companies more than physical stores. Also of note was that Macy’s, similar to McDonald’s (MCD; off 2.9% for the month), said it would not do a spin-off of its real estate assets. S&P Dow Jones Indices made four sets of changes to the S&P 500 in November. Technology solutions issue Hewlett Packard Enterprise (HPE), which was spun off by Hewlett-Packard (HPQ; renamed to HP), was added to the index and Hudson City Bancorp (HCBK) was removed. Data processing and services issue CSRA (CSRA), which was spun off from Computer Sciences (CSC), was added to the index, while Computer Sciences was removed. Consumer financial services issue Synchrony Financial (SYF) was added and Genworth Financial (GNW) was removed, while genetic health care issue Illumina (ILMN) was added and Sigma-Aldrich (SIAL) was removed. Interest rates increased slightly for the month, as many expect the U.S. Fed to finally increase interest rates by 0.25% in December. The 10-year U.S. Treasury Bond closed at 2.22% (from last month’s 2.14%, year-end 2014’s 2.17%, and 2013’s 3.03%). The 30-year U.S. Treasury Bond closed at 2.98% (2.92%, 2.75%, 3.94%). The U.S. dollar gained, as the euro closed at 1.0569 (1.1007, 1.2098, 1.3756), the pound closed at 1.5055 (1.5427, 1.5582, 1.6564), the yen closed at 123.26 (120.62, 119.80, 105.20 [reverse reference, which is usually used]), and the yuan closed at 6.3994 (6.35161, and 6.2104 prior to the Aug. 10, 2015, devaluation). Gold declined to close at USD 1,064.30 (1,141.70, 1,183.20, 1,204.80). Oil moved from the mid-USD 40 area to the low-USD 40s, as it traded under USD 40 and closed the month at USD 41.72 (46.39, 53.27, 98.70). U.S. pump prices decreased to end the month at USD 2.094 (2.228, 2.299, 3.271). VIX®, “the fear factor,” increased, closing at 16.13, which was up from last month’s 15.09 but significantly down from the prior month’s 24.50. INDEX REVIEW S&P 500 It was a difficult month for the S&P 500, as global events (Paris and Turkey) and economics (Japan’s recession versus the stronger GDP report from the U.S.) tested the index, with last month’s broad 8.30% gain tempting some as the end of the year approaches. In the end, at least for November, the S&P 500 posted a slight 0.05% gain to close at 2,080.41, as a quarter-point Fed increase was expected. Military issues (and some actions) remained in the news but declined by month’s end, and the economy remained the key issue. Four of the ten sectors gained for the month, which was down from last month’s broad gains, when all 10 increased. Sector returns continued to be varied. Utilities fell 2.75% in November (the worst sector for the month) after posting a 1.05% gain in October, as it broke into the double-digit loss column for the year, off 10.05% YTD. Energy was already in the double-digit loss column, and it posted a 0.77% decline this month, as oil stayed in the low USD 40s and closed at USD 41.72, down from USD 46.39. Year-to-date, energy was off 15.06% (the worst 4
5) Market Attributes | U.S. Equities November 2015 sector YTD). Financials performed the best for the month, up 1.70%, as the “assumed’ start of the quarter-point move was seen as helping margins; the sector, however, remained in the red for the year, off 1.15% YTD. Health care posted a 0.60% loss this month, as concerns over the profitability of Obamacare grew; the sector was up 3.54% YTD. Consumer sectors, however, received the most coverage, as the holiday season started and the bricks-to-clicks shopping trend appeared to continue, resulting in poor store showings and better web-based sales. Consumer discretionary posted a 0.36% decline for the month, but it easily held on to the title of best-performing sector for the year, as it was up 11.74% YTD. Information technology was in a distant second place, up 6.76% YTD, as it posted a 0.59% November gain. Consumer staples declined 1.27% for the month, but it remained positive YTD at 1.23%. For the month, 263 issues were up (an average increase of 4.53%) and 241 were down (an average loss of 5.31%), as 24 added at least 10% (an average increase of 16.52%) and 30 were down at least 10% (an average loss of 18.32%). The race for the end of the year is underway, with the potential for window dressing as funds wish to show their best portfolio and best possible 2015 performance. Year-to-date the S&P 500, which is the largest benchmark used by funds, was up 1.04% (up 3.01% with dividends). However, the low overall change hides the fact that 61% of the issues have moved over 10% YTD: 147 up at least 10% and 161 down at least 10%. Index players, at this point, are expected to show modest returns for the year, after three years of double-digit gains. Active players and managers may be more on the tail ends, showing much larger gains or losses. To get an early read on which is which, just check to see who is buying at the bar (for the winners), as well as who may be drinking less than top-shelf brands (for the losers). The Dow® It was a good month for The Dow, as it gained 0.32%. Of course you might have been disappointed if you expected an encore to October’s 8.47% gain, but most seemed to be pleased that there was no retreat. The actual issue movement was split, as 15 issues gained (up an average 2.61%), and 15 issues declined (off an average 2.09%). Retail dominated the news, as holiday shopping started, and some hints of reality affected stocks. Building and home improvement issue Home Depot (HD) did the best, up 8.3% for the month and up 27.5% YTD, as its earnings and forecast beat estimates; absent Home Depot’s gain, The Dow would have been in the red for month. Discount store Wal-Mart (WMT) added 2.8% in November, as it tried to lure shoppers with new in-store and online price matches; the issue, however, remained off 31.5% YTD (the worst of any issue in the index). Specific consumerrelated issues mostly did well, as footwear and athletic issue NIKE (NKE) added 1.0% this month, helped by a pending two-for-one stock split announcement, as it was up 37.8% YTD (the best of any issue in the index). On the down side was computer network issue Cisco Systems, which fell 5.5% this month and moved into the red YTD, off 2.0%, as well as telecommunication services issue Verizon Communication (VZ), which lost 3.1% for the month and also moved into negative territory YTD, off 2.8%. Of note was managed health care issue UnitedHealth Group, which questioned its profitability from and long-term commitment to Obamacare; the issue was off 4.3% for the month, however it remained up 11.49% YTD. S&P MidCap 400 The S&P MidCap 400 posted a 1.18% November gain, after last month’s 5.54% gain, as it beat the large-caps for the month, but trailed small-caps’ 2.52% gain. Health care did the best this month, up 2.88%, as it retained its lead as the best-performing mid-cap sector YTD, up 9.87%. Financials were right behind with a 2.64% November gain, as higher rates were seen as helping margins. Consumer sectors fell, as consumer discretionary posted a 1.21% decline for the month, leaving it 6.36% in the red YTD. Consumer staples fell deeper, off 2.64% in November and moving into the red YTD, off 1.18%. Energy posted a 1.08% gain, but after the sector’s October rebound of 10.38% that came after the prior month’s 10.98% decline, investors appeared content. Breadth remained positive, as 254 5
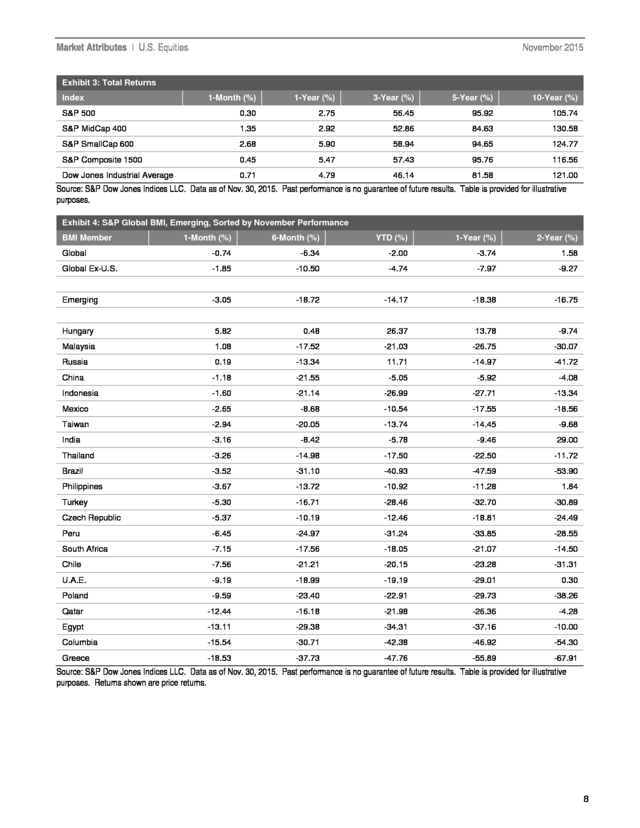
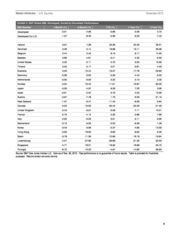
6) Market Attributes | U.S. Equities November 2015 issues gained (with an average gain of 5.39%), down from last month’s 321 issues, while 146 issues declined (an average loss of 5.98%), up from last month’s 77. Overall moves of at least 10% declined significantly but were not favorable, as 31 issues moved up at least 10% from last month’s 123, and 28 issues were off at least 10%, up from last month’s 18 issues. Year-to-date, the S&P MidCap 400 moved back into the black, up 0.65%, as 196 issues were up and 196 were down. However, the level of underlying issue change remained high, as 62% of the issues have moved at least 10% YTD: 130 up (averaging a 24.37% gain) and 117 down (averaging a 26.48% loss). The result is that the index has smoothed out the extremes. S&P SmallCap 600 The S&P SmallCap 600 posted a 2.52% gain for the month, the best monthly return of the headline indices, after its broad 6.02% gain last month. The gain lifted the index into the black for the year, up 1.68%, which was also the best YTD return of any of the core indices. For the month, 397 issues gained (an average of 8.21%) after last month’s 441 gainers, while 201 issues decreased (an average loss of 8.46%), up from last month’s 157 decliners. The index continued its issue-level volatility, as significant gainers of at least 10% numbered 110 issues (up an average of 17.27%), while 55 issues declined at least 10% (off an average of 20.99%). Health care did the best this month, up 7.69%, as the concern over larger-cap issues’ profitability (large-cap health care was off 0.34% for the month) was negated by the need for services and equipment; 27 of the 73 issues were up at least 10%, as three were down at least 10%. Year-to-date, the sector was up 20.83%—the best of any sector in the any of the four headline indices. Energy added 3.34% in November, as oil increased, and just as importantly, it appeared to be supported in the low USD 40s (it had broken under USD 40). The sector, however, remained deeply in the red for the year, off 36.57% YTD, the worst sector of any in the core indices. Information technology was also notable in the S&P SmallCap 600, as it gained 4.87% and was up 7.95% YTD. S&P Global BMI Global markets had a hard act to follow after their broad 7.51% October gain, as November posted a 0.74% decline. The decline was actually much deeper, off 1.85%, excluding the 0.32% gain posted by the U.S. However, it did not appear that the loss was the center of attention, but rather it was the prospects for growth and the unevenness of the economic cycle, as U.S. interest rates were expected to be increased in December, and the ECB was expected to increase stimulus. For the month, 10 of the 47 markets posted gains, compared to 42 last month (but more than the four that gained the month prior to that). Year-to-date, global markets remained in the red, off 2.00%, with a 4.74% decline excluding the 0.72% gain from the U.S. Emerging markets posted a deeper loss for November, off 3.05%, as only 3 of the 22 markets posted gains. Hungary did the best for the month, up 5.82%, which left the market up 26.37% YTD (the best in the group). Malaysia was next with a 1.08% gain for the month, but it remained off 21.03% YTD. Russia was the third market with a gain this month, be it only 0.19%, as it was up 11.71% YTD. Greece did the worst, as it continued to have difficulties with its promised changes, falling 19.53% for the month and off 47.76% YTD, the worst of any market. Colombia fell 15.54% in November (off 42.38% YTD), with Egypt also posting a double-digit decline this month, off 13.11% (off 34.13% YTD). For the month, China posted a 1.18% decline, as it posted a loss of 5.05% YTD. Developed markets posted a 0.51% decline in November, but absent the U.S., the decline was 1.57%. Developed markets were not as extreme as emerging markets in terms of their gains or their losses. Of the 25 markets, seven gained, speaking to the top-heavy returns, compared to 24 of the 25 last month. Ireland did the best, up 3.67% this month and 23.38% YTD. For the month, Denmark was up 3.35% (up 18.89% YTD), as Belgium was up 2.44% (up 9.15% YTD). Portugal performed the worst in November, off 6.73%, as it slipped into the red for the year, off 4.97% YTD. 6
7) Market Attributes | U.S. Equities November 2015 PERFORMANCE RECAP Exhibit 2: Monthly Returns S&P 500 Price 1-Month (%) 1-Year (%) 3-Year (%) 5-Year (%) FR 12/99 (%) Energy 498.26 -0.77 -14.77 -6.03 7.10 134.23 Materials 286.31 0.59 -7.05 23.97 31.63 78.99 Industrials 474.00 0.60 -2.89 47.43 69.32 73.39 Consumer Discretionary 640.02 -0.36 12.59 70.60 125.21 113.83 Consumer Staples 505.71 -1.27 -0.16 36.61 72.96 143.07 Health Care 820.04 -0.60 2.04 76.46 134.55 150.94 Financials 329.48 1.70 0.45 55.71 69.72 2.41 Information Technology 738.69 0.59 4.90 59.07 92.14 -8.51 Telecommunication Services 147.38 -1.33 -9.36 -0.18 23.17 -54.34 Utilities 216.01 -2.75 -7.14 21.29 39.29 51.65 S&P 500 Dow Jones Industrial Average Dow Jones Industrial Average 2080.41 0.05 0.62 46.90 76.22 41.60 Price 1-Month (%) 1-Year (%) 3-Year (%) 5-Year (%) FR 12/99 (%) 17719.92 0.32 -0.61 36.04 61.00 54.12 Price 1-Month (%) 1-Year (%) 3-Year (%) 5-Year (%) FR 12/99 (%) Energy 525.54 1.08 -23.74 -20.43 -27.37 199.51 Materials 338.83 1.24 -8.95 20.90 46.42 205.34 Industrials 702.09 2.48 0.85 50.67 86.03 294.39 Consumer Discretionary 643.50 -1.21 -5.96 43.50 84.25 223.50 Consumer Staples 1559.10 -2.64 0.13 82.23 158.67 794.92 Health Care 1218.72 2.88 13.41 99.09 172.86 588.87 740.14 2.64 7.61 46.63 62.37 123.71 1621.25 0.77 6.04 49.10 55.62 92.40 Telecommunication Services 256.66 -1.22 -7.01 34.06 44.30 -45.75 Utilities 390.79 -2.65 -6.77 27.11 50.04 182.12 1461.81 1.18 1.33 46.16 71.45 228.74 S&P MidCap 400 Financials Information Technology S&P MidCap 400 S&P SmallCap 600 Price 1-Month (%) 1-Year (%) 3-Year (%) 5-Year (%) FR 12/99 (%) Energy 677.96 3.34 -38.37 -43.00 -36.34 336.27 Materials 343.88 -1.31 -18.57 11.86 27.88 149.44 Industrials 768.03 2.60 4.34 52.07 77.88 284.13 Consumer Discretionary 442.21 -2.48 -4.04 48.66 80.53 226.28 Consumer Staples 1398.57 1.30 8.01 62.05 108.54 601.57 Health Care 1725.75 7.81 24.13 110.28 191.42 853.24 Financials 779.94 2.63 6.55 43.49 72.41 166.27 Information Technology 472.81 4.87 11.68 84.47 101.58 72.89 2.54 2.01 4.89 9.77 -0.30 -96.54 Utilities 695.02 -1.47 10.41 44.02 61.63 270.28 S&P SmallCap 600 706.75 2.52 4.42 52.93 82.83 257.32 Telecommunication Services Source: S&P Dow Jones Indices LLC. Data as of Nov. 30, 2015. Past performance is no guarantee of future results. Table is provided for illustrative purposes. Returns shown are price returns. 7
8) Market Attributes | U.S. Equities November 2015 Exhibit 3: Total Returns Index 1-Month (%) 1-Year (%) 3-Year (%) 5-Year (%) 10-Year (%) S&P 500 0.30 2.75 56.45 95.92 105.74 S&P MidCap 400 1.35 2.92 52.86 84.63 130.58 S&P SmallCap 600 2.68 5.90 58.94 94.65 124.77 S&P Composite 1500 0.45 5.47 57.43 95.76 116.56 Dow Jones Industrial Average 0.71 4.79 46.14 81.58 121.00 Source: S&P Dow Jones Indices LLC. Data as of Nov. 30, 2015. Past performance is no guarantee of future results. Table is provided for illustrative purposes. Exhibit 4: S&P Global BMI, Emerging, Sorted by November Performance BMI Member 1-Month (%) 6-Month (%) YTD (%) 1-Year (%) 2-Year (%) Global -0.74 -6.34 -2.00 -3.74 1.58 Global Ex-U.S. -1.85 -10.50 -4.74 -7.97 -9.27 Emerging -3.05 -18.72 -14.17 -18.38 -16.75 Hungary 5.82 0.48 26.37 13.78 -9.74 Malaysia 1.08 -17.52 -21.03 -26.75 -30.07 Russia 0.19 -13.34 11.71 -14.97 -41.72 China -1.18 -21.55 -5.05 -5.92 -4.08 Indonesia -1.60 -21.14 -26.99 -27.71 -13.34 Mexico -2.65 -8.68 -10.54 -17.55 -18.56 Taiwan -2.94 -20.05 -13.74 -14.45 -9.68 India -3.16 -8.42 -5.78 -9.46 29.00 Thailand -3.26 -14.98 -17.50 -22.50 -11.72 Brazil -3.52 -31.10 -40.93 -47.59 -53.90 Philippines -3.67 -13.72 -10.92 -11.28 1.84 Turkey -5.30 -16.71 -28.46 -32.70 -30.89 Czech Republic -5.37 -10.19 -12.46 -18.81 -24.49 Peru -6.45 -24.97 -31.24 -33.85 -28.55 South Africa -7.15 -17.56 -18.05 -21.07 -14.50 Chile -7.56 -21.21 -20.15 -23.28 -31.31 U.A.E. -9.19 -18.99 -19.19 -29.01 0.30 Poland -9.59 -23.40 -22.91 -29.73 -38.26 Qatar -12.44 -16.18 -21.98 -26.36 -4.28 Egypt -13.11 -29.38 -34.31 -37.16 -10.00 Columbia -15.54 -30.71 -42.38 -46.92 -54.30 Greece -18.53 -37.73 -47.76 -55.89 -67.91 Source: S&P Dow Jones Indices LLC. Data as of Nov. 30, 2015. Past performance is no guarantee of future results. Table is provided for illustrative purposes. Returns shown are price returns. 8
9) Market Attributes | U.S. Equities November 2015 Exhibit 5: S&P Global BMI, Developed, Sorted by November Performance BMI Member 1-Month (%) 6-Month (%) YTD (%) 1-Year (%) 2-Year (%) Developed -0.51 -4.96 -0.66 -2.08 3.72 Developed Ex-U.S. -1.57 -8.46 -2.38 -5.32 -7.40 Ireland 3.67 7.28 23.38 22.33 26.51 Denmark 3.35 0.14 18.89 13.11 30.96 Belgium 2.44 2.42 9.15 6.17 14.62 Sweden 0.83 -4.81 -0.41 -4.32 -5.53 United States 0.32 -2.11 0.72 0.53 13.90 Finland 0.20 -0.17 0.21 -3.81 -4.03 Australia 0.03 -15.44 -15.57 -17.76 -23.82 Germany -0.26 -3.62 -0.26 -4.42 -9.52 Netherlands -0.50 -6.63 3.20 0.10 2.32 Norway -0.54 -16.45 -11.61 -16.87 -32.02 Japan -0.55 -4.97 8.35 7.25 3.95 Israel -0.61 -2.64 3.75 2.23 13.92 Austria -0.67 -7.78 1.73 -5.33 -21.19 New Zealand -1.07 -6.47 -11.40 -9.35 -5.84 Canada -2.20 -16.63 -20.42 -22.25 -21.03 United Kingdom -2.43 -9.67 -5.09 -7.11 -10.31 France -2.73 -4.12 2.33 -2.88 -7.86 Italy -2.92 -6.05 5.91 -2.11 -5.90 Switzerland -3.13 -9.62 -2.02 -6.38 -1.26 Korea -3.43 -9.68 -2.37 -4.80 -13.53 Hong Kong -3.65 -18.62 -5.83 -9.62 -5.35 Spain -3.79 -11.59 -12.66 -19.19 -16.64 Luxembourg -4.07 -27.80 -26.89 -31.55 -33.53 Singapore -4.71 -18.31 -18.92 -19.99 -20.72 Portugal -6.73 -13.23 -4.97 -14.82 -36.65 Source: S&P Dow Jones Indices LLC. Data as of Nov. 30, 2015. Past performance is no guarantee of future results. Table is provided for illustrative purposes. Returns shown are price returns. 9
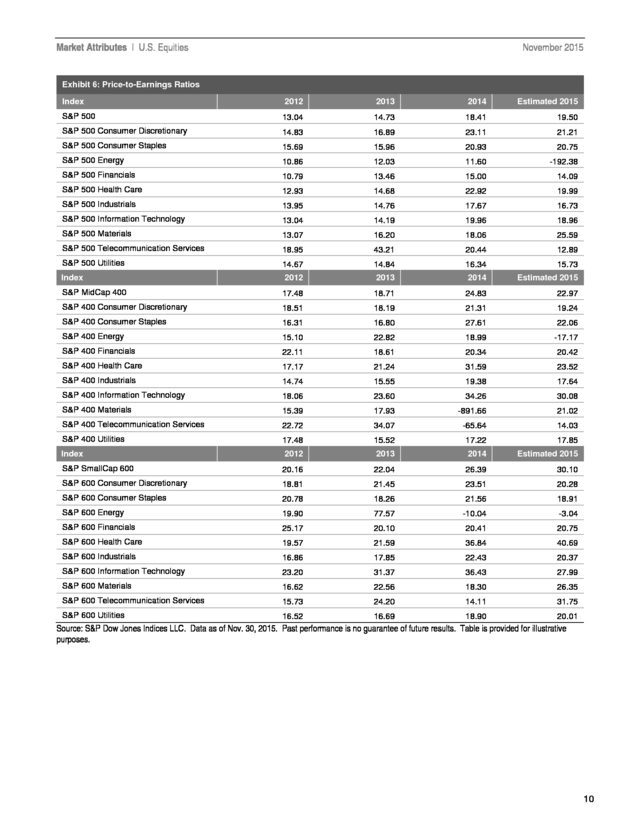
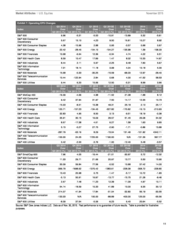
10) Market Attributes | U.S. Equities November 2015 Exhibit 6: Price-to-Earnings Ratios Index 2012 2013 2014 Estimated 2015 S&P 500 13.04 14.73 18.41 19.50 S&P 500 Consumer Discretionary 14.83 16.89 23.11 21.21 S&P 500 Consumer Staples 15.69 15.96 20.93 20.75 S&P 500 Energy 10.86 12.03 11.60 -192.38 S&P 500 Financials 10.79 13.46 15.00 14.09 S&P 500 Health Care 12.93 14.68 22.92 19.99 S&P 500 Industrials 13.95 14.76 17.67 16.73 S&P 500 Information Technology 13.04 14.19 19.96 18.96 S&P 500 Materials 13.07 16.20 18.06 25.59 S&P 500 Telecommunication Services 18.95 43.21 20.44 12.89 S&P 500 Utilities 14.67 14.84 16.34 15.73 Index 2012 2013 2014 Estimated 2015 S&P MidCap 400 17.48 18.71 24.83 22.97 S&P 400 Consumer Discretionary 18.51 18.19 21.31 19.24 S&P 400 Consumer Staples 16.31 16.80 27.61 22.06 S&P 400 Energy 15.10 22.82 18.99 -17.17 S&P 400 Financials 22.11 18.61 20.34 20.42 S&P 400 Health Care 17.17 21.24 31.59 23.52 S&P 400 Industrials 14.74 15.55 19.38 17.64 S&P 400 Information Technology 18.06 23.60 34.26 30.08 S&P 400 Materials 15.39 17.93 -891.66 21.02 S&P 400 Telecommunication Services 22.72 34.07 -65.64 14.03 S&P 400 Utilities 17.48 15.52 17.22 17.85 Index 2012 2013 2014 Estimated 2015 S&P SmallCap 600 20.16 22.04 26.39 30.10 S&P 600 Consumer Discretionary 18.81 21.45 23.51 20.28 S&P 600 Consumer Staples 20.78 18.26 21.56 18.91 S&P 600 Energy 19.90 77.57 -10.04 -3.04 S&P 600 Financials 25.17 20.10 20.41 20.75 S&P 600 Health Care 19.57 21.59 36.84 40.69 S&P 600 Industrials 16.86 17.85 22.43 20.37 S&P 600 Information Technology 23.20 31.37 36.43 27.99 S&P 600 Materials 16.62 22.56 18.30 26.35 S&P 600 Telecommunication Services 15.73 24.20 14.11 31.75 S&P 600 Utilities 16.52 16.69 18.90 20.01 Source: S&P Dow Jones Indices LLC. Data as of Nov. 30, 2015. Past performance is no guarantee of future results. Table is provided for illustrative purposes. 10
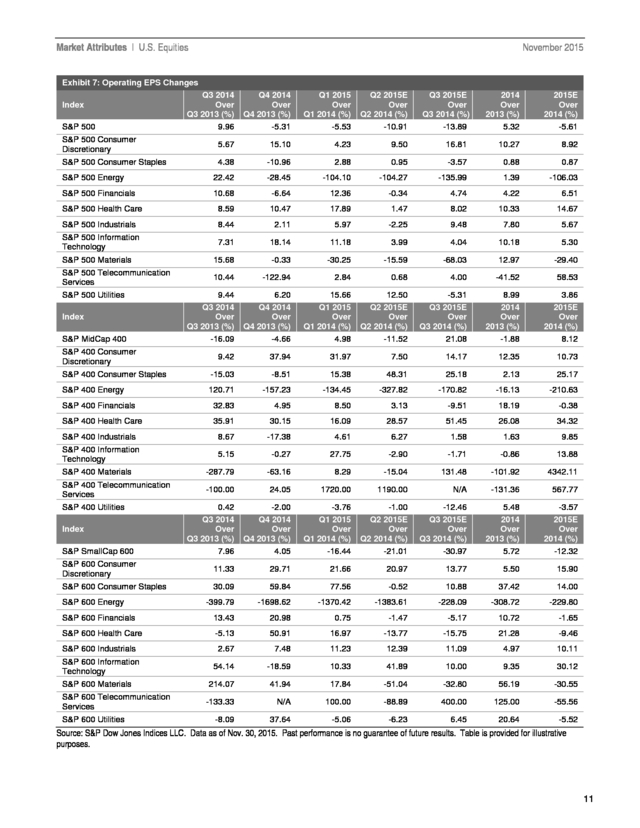
11) Market Attributes | U.S. Equities November 2015 Exhibit 7: Operating EPS Changes Q3 2014 Over Q3 2013 (%) 9.96 Q4 2014 Over Q4 2013 (%) -5.31 Q1 2015 Over Q1 2014 (%) -5.53 Q2 2015E Over Q2 2014 (%) -10.91 2014 Over 2013 (%) 5.32 2015E Over 2014 (%) -5.61 S&P 500 Consumer Discretionary 5.67 15.10 4.23 9.50 16.81 10.27 8.92 S&P 500 Consumer Staples 4.38 -10.96 2.88 0.95 -3.57 0.88 0.87 S&P 500 Energy 22.42 -28.45 S&P 500 Financials 10.68 -6.64 -104.10 -104.27 -135.99 1.39 -106.03 12.36 -0.34 4.74 4.22 6.51 S&P 500 Health Care 8.59 10.47 17.89 1.47 8.02 10.33 14.67 S&P 500 Industrials S&P 500 Information Technology 8.44 2.11 5.97 -2.25 9.48 7.80 5.67 7.31 18.14 11.18 3.99 4.04 10.18 5.30 S&P 500 Materials 15.68 -0.33 -30.25 -15.59 -68.03 12.97 -29.40 S&P 500 Telecommunication Services 10.44 -122.94 2.84 0.68 4.00 -41.52 58.53 9.44 Q3 2014 Over Q3 2013 (%) -16.09 6.20 Q4 2014 Over Q4 2013 (%) -4.66 15.66 Q1 2015 Over Q1 2014 (%) 4.98 12.50 Q2 2015E Over Q2 2014 (%) -11.52 -5.31 Q3 2015E Over Q3 2014 (%) 21.08 8.99 2014 Over 2013 (%) -1.88 3.86 2015E Over 2014 (%) 8.12 9.42 37.94 31.97 7.50 14.17 12.35 10.73 Index S&P 500 S&P 500 Utilities Index S&P MidCap 400 S&P 400 Consumer Discretionary Q3 2015E Over Q3 2014 (%) -13.89 S&P 400 Consumer Staples -15.03 -8.51 15.38 48.31 25.18 2.13 25.17 S&P 400 Energy 120.71 -157.23 -134.45 -327.82 -170.82 -16.13 -210.63 S&P 400 Financials 32.83 4.95 8.50 3.13 -9.51 18.19 -0.38 S&P 400 Health Care 35.91 30.15 16.09 28.57 51.45 26.08 34.32 S&P 400 Industrials 8.67 -17.38 4.61 6.27 1.58 1.63 9.85 S&P 400 Information Technology 5.15 -0.27 27.75 -2.90 -1.71 -0.86 13.88 S&P 400 Materials -287.79 -63.16 8.29 -15.04 131.48 -101.92 4342.11 S&P 400 Telecommunication Services -100.00 24.05 1720.00 1190.00 N/A -131.36 567.77 0.42 Q3 2014 Over Q3 2013 (%) 7.96 -2.00 Q4 2014 Over Q4 2013 (%) 4.05 -3.76 Q1 2015 Over Q1 2014 (%) -16.44 -1.00 Q2 2015E Over Q2 2014 (%) -21.01 -12.46 Q3 2015E Over Q3 2014 (%) -30.97 5.48 2014 Over 2013 (%) 5.72 -3.57 2015E Over 2014 (%) -12.32 S&P 600 Consumer Discretionary 11.33 29.71 21.66 20.97 13.77 5.50 15.90 S&P 600 Consumer Staples 30.09 59.84 77.56 -0.52 10.88 37.42 14.00 -399.79 -1698.62 -1370.42 -1383.61 -228.09 -308.72 -229.80 S&P 600 Financials 13.43 20.98 0.75 -1.47 -5.17 10.72 -1.65 S&P 600 Health Care S&P 400 Utilities Index S&P SmallCap 600 S&P 600 Energy -5.13 50.91 16.97 -13.77 -15.75 21.28 -9.46 S&P 600 Industrials 2.67 7.48 11.23 12.39 11.09 4.97 10.11 S&P 600 Information Technology 54.14 -18.59 10.33 41.89 10.00 9.35 30.12 214.07 41.94 17.84 -51.04 -32.80 56.19 -30.55 -133.33 N/A 100.00 -88.89 400.00 125.00 -55.56 -8.09 37.64 -5.06 -6.23 6.45 20.64 -5.52 S&P 600 Materials S&P 600 Telecommunication Services S&P 600 Utilities Source: S&P Dow Jones Indices LLC. Data as of Nov. 30, 2015. Past performance is no guarantee of future results. Table is provided for illustrative purposes. 11
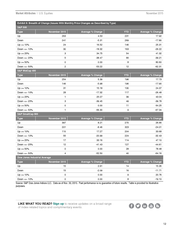
12) Market Attributes | U.S. Equities November 2015 Exhibit 8: Breadth of Change (Issues With Monthly Price Changes as Described by Type) S&P 500 Type November 2015 Average % Change YTD Average % Change Up 263 4.53 231 17.92 Down 241 -5.31 269 -17.80 Up >= 10% 24 16.52 146 25.31 Down <= -10% 30 -18.32 163 -26.22 Up >= 25% 3 34.75 54 41.32 Down <= -25% 5 -38.47 66 -39.21 Up >= 50% 0 0.00 8 80.60 Down <= -50% 2 -53.22 12 -62.31 November 2015 Average % Change YTD Average % Change Up 254 5.39 196 17.73 Down S&P MidCap 400 Type 146 -5.98 196 -17.90 Up >= 10% 31 15.18 130 24.37 Down <= -10% 28 -17.32 117 -26.48 Up >= 25% 1 25.07 39 43.04 Down <= -25% 3 -39.45 49 -39.78 Up >= 50% 0 0.00 11 64.25 Down <= -50% 1 -56.30 9 -67.34 November 2015 Average % Change YTD Average % Change 397 8.21 270 26.66 S&P SmallCap 600 Type Up Down 201 -8.46 323 -24.01 Up >= 10% 110 17.27 204 33.68 Down <= -10% 55 -20.99 224 -32.43 Up >= 25% 17 33.16 114 47.10 Down <= -25% 12 -41.43 127 -44.61 Up >= 50% 0 0.00 28 78.48 Down <= -50% 4 -52.50 40 -64.16 November 2015 Average % Change YTD Average % Change Up 15 2.61 14 15.35 Down Dow Jones Industrial Average Type 15 -2.09 16 -11.71 Up >= 10% 0 0.00 9 20.76 Down <= -10% 0 0.00 8 -19.10 Source: S&P Dow Jones Indices LLC. Data as of Nov. 30, 2015. Past performance is no guarantee of future results. Table is provided for illustrative purposes. LIKE WHAT YOU READ? Sign up to receive updates on a broad range of index-related topics and complimentary events. 12
13) Market Attributes | U.S. Equities November 2015 GENERAL DISCLAIMER ® © 2015 by S&P Dow Jones Indices LLC, a part of McGraw Hill Financial, Inc. All rights reserved. Standard & Poor’s and ® S&P are registered trademarks of Standard & Poor’s Financial Services LLC (“S&P”), a subsidiary of McGraw Hill Financial. ® Dow Jones is a registered trademark of Dow Jones Trademark Holdings LLC (“Dow Jones”). Trademarks have been licensed to S&P Dow Jones Indices LLC. Redistribution, reproduction and/or photocopying in whole or in part are prohibited without written permission. This document does not constitute an offer of services in jurisdictions where S&P Dow Jones Indices LLC, Dow Jones, S&P or their respective affiliates (collectively “S&P Dow Jones Indices”) do not have the necessary licenses. All information provided by S&P Dow Jones Indices is impersonal and not tailored to the needs of any person, entity or group of persons. S&P Dow Jones Indices receives compensation in connection with licensing its indices to third parties. Past performance of an index is not a guarantee of future results It is not possible to invest directly in an index. Exposure to an asset class represented by an index is available through investable instruments based on that index. S&P Dow Jones Indices does not sponsor, endorse, sell, promote or manage any investment fund or other investment vehicle that is offered by third parties and that seeks to provide an investment return based on the performance of any index. S&P Dow Jones Indices makes no assurance that investment products based on the index will accurately track index performance or provide positive investment returns. S&P Dow Jones Indices LLC is not an investment advisor, and S&P Dow Jones Indices makes no representation regarding the advisability of investing in any such investment fund or other investment vehicle. A decision to invest in any such investment fund or other investment vehicle should not be made in reliance on any of the statements set forth in this document. Prospective investors are advised to make an investment in any such fund or other vehicle only after carefully considering the risks associated with investing in such funds, as detailed in an offering memorandum or similar document that is prepared by or on behalf of the issuer of the investment fund or other vehicle. Inclusion of a security within an index is not a recommendation by S&P Dow Jones Indices to buy, sell, or hold such security, nor is it considered to be investment advice. Closing prices for S&P US benchmark indices and Dow Jones US benchmark indices are calculated by S&P Dow Jones Indices based on the closing price of the individual constituents of the index as set by their primary exchange. Closing prices are received by S&P Dow Jones Indices from one of its third party vendors and verified by comparing them with prices from an alternative vendor. The vendors receive the closing price from the primary exchanges. Real-time intraday prices are calculated similarly without a second verification.] These materials have been prepared solely for informational purposes based upon information generally available to the public and from sources believed to be reliable. No content contained in these materials (including index data, ratings, credit-related analyses and data, research, valuations, model, software or other application or output therefrom) or any part thereof (Content) may be modified, reverse-engineered, reproduced or distributed in any form or by any means, or stored in a database or retrieval system, without the prior written permission of S&P Dow Jones Indices. The Content shall not be used for any unlawful or unauthorized purposes. S&P Dow Jones Indices and its third-party data providers and licensors (collectively “S&P Dow Jones Indices Parties”) do not guarantee the accuracy, completeness, timeliness or availability of the Content. S&P Dow Jones Indices Parties are not responsible for any errors or omissions, regardless of the cause, for the results obtained from the use of the Content. The Content is provided on an “as is” basis. S&P DOW JONES INDICES PARTIES DISCLAIM ANY AND ALL EXPRESS OR IMPLIED WARRANTIES, INCLUDING, BUT NOT LIMITED TO, ANY WARRANTIES OF MERCHANTABILITY OR FITNESS FOR A PARTICULAR PURPOSE OR USE, FREEDOM FROM BUGS, SOFTWARE ERRORS OR DEFECTS, THAT THE CONTENT’S FUNCTIONING WILL BE UNINTERRUPTED OR THAT THE CONTENT WILL OPERATE WITH ANY SOFTWARE OR HARDWARE CONFIGURATION. In no event shall S&P Dow Jones Indices Parties be liable to any party for any direct, indirect, incidental, exemplary, compensatory, punitive, special or consequential damages, costs, expenses, legal fees, or losses (including, without limitation, lost income or lost profits and opportunity costs) in connection with any use of the Content even if advised of the possibility of such damages. S&P Dow Jones Indices keeps certain activities of its business units separate from each other in order to preserve the independence and objectivity of their respective activities. As a result, certain business units of S&P Dow Jones Indices may have information that is not available to other business units. S&P Dow Jones Indices has established policies and procedures to maintain the confidentiality of certain non-public information received in connection with each analytical process. In addition, S&P Dow Jones Indices provides a wide range of services to, or relating to, many organizations, including issuers of securities, investment advisers, broker-dealers, investment banks, other financial institutions and financial intermediaries, and accordingly may receive fees or other economic benefits from those organizations, including organizations whose securities or services they may recommend, rate, include in model portfolios, evaluate or otherwise address. 13