Severity: Notice
Message: Undefined variable: content_category
Filename: user/transcript.php
Line Number: 106
Severity: Warning
Message: Invalid argument supplied for foreach()
Filename: user/transcript.php
Line Number: 106


1) U.S. Equity Indices | October 2015 KEY HIGHLIGHTS ï‚· ï‚· ï‚· ï‚· The S&P 500® increased 8.30% in October, making its YTD return the best of the headline indices, up 0.99%. The Dow Jones Industrial Average® returned 8.47% this month, but it still came in off 0.90% YTD. The S&P MidCap 400® was up 5.54% for the month, but down 0.53% YTD. The S&P SmallCap 600® returned 6.02% in October, bringing its YTD return to -0.82%. Exhibit 1: Index Returns Index 1-Month (%) YTD (%) 1-Year (%) S&P 500 8.30 0.99 3.04 Dow Jones Industrial Average 8.47 -0.90 1.57 S&P MidCap 400 5.54 -0.53 1.84 S&P SmallCap 600 6.02 -0.82 1.45 Source: S&P Dow Jones Indices LLC. Data as of Oct. 30, 2015. Past performance is no guarantee of future results. Table is provided for illustrative purposes. Returns shown are price returns. MARKET SNAPSHOT There’s a great, big, beautiful tomorrow coming at the start of every earnings season—and the S&P 500 had its “tomorrow” this month, as it posted its best performance since October 2011 with a broad 8.30% gain that wiped out its third quarter loss of 6.97%. The reporting season is all about expectations, and so far this quarter, with 75% of the issues reported, 70% have beaten their reduced estimates; hence the 8.30% October gain (managing earnings should be an MBA-required course). To be fair and honest, this month actually held a trifecta of events that prompted the best month in four years. Earnings came in first, with forecasts pointing to continued growth, and Q4 2015 is expected to set record earnings (even if it’s only by USD 0.01, being in the area is a plus). In second place was the Fed, which decided against changing interest rates, but it kept December on the table as a possibility, and the game of “when” continued. Currently, Q1 2016 is the favorite, with December 2015 only slightly behind that. However, most agree that the Fed remains data-dependent, and expected economic reports (employment, GDP, consumer, and production costs) between now and the Fed’s Dec. 15-16, 2016, meeting will have a major impact on its decision. Coming in a distant third, but still placing, was M&A, as major deals continued. Also in the race was the U.S. Congress, which changed leadership in the House of Representatives and approved a two-year budget deal, which included a “fix” to the debt limit issue that could have shut down the government. Contributor: Howard Silverblatt, Index Investment Strategy, Senior Industry Analyst, howard.silverblatt@spdji.com S&P Dow Jones Indices’ Market Attributes® series provides market commentary highlighting developments across various asset classes.
2) Market Attributes | U.S. Equities October 2015 It was a good month for M&A, which should continue to contribute to brokerage income sheets. Anheuser-Busch InBev (AHBIF; up 14.6% for the month) and SABMiller (SBMRF; up 7.7% for the month) finally got together, as their “cat-and-mouse” courtship took hold for USD 106 billion. Privately held computer maker Dell (DELL) said it would buy computer storage product maker EMC (EMC; up 8.5% for the month) for USD 67 billion in cash and tracking stock of 80% held in EMC’s WMware (VMW; off 23.7%) unit (the largest technology merger in history). Investment management issue Blackstone (BX) said it would purchase New York City’s biggest apartment complex (Stuyvesant and Peter Cooper, 11,200 units) for USD 5.3 billion, and Equity Residential said it would sell 23,000 multidwelling units to Starwood Capital Group for USD 5.4 billion. Wafer fabrication equipment issue (for semiconductors) Lam Research (LRCX; up 17.2% for the month) said it would buy KLA-Tencor (KLAC; up 34.2% for the month) for USD 10.6 billion. Atlanta-based energy commodity trading exchange Intercontinental Exchange (ICE; up 7.4% for the month) said it would buy Interactive Data (which was reportedly trying to do an IPO) for USD 5.2 billion. Electric & gas utility Duke Energy (DUK; off 0.7% for the month) said it would buy Piedmont Natural Gas (PNY; up 43.0% for the month) for USD 4.9 billion. Bridgestone said it would buy Pep Boys (PBY; up 23.3% for the month) for USD 0.8 billion. Commercial regional bank KeyCorp (KEY; off 4.5% for the month) said it would buy First Niagara (FNFG; up 1.4% for the month) for USD 4.1 billion. Health care products maker Pfizer (PFE; up 7.7% for the month) and off-patent medications producer Allergan (AGN; up 13.5% for the month) were in merger talks for a deal that could potentially be worth USD 300 or more, with the issue of domicile taxes coming up since Allergan is domiciled in Ireland. Economic news was also plentiful, with two standouts. First, the Fed decided not to increase rates, but it will keep the option on the table for December 2015 (as it again claims to be data-dependent); the Street odds are still pointing to 2016. Second, the first of three looks at third quarter GDP came in close to expectations, at 1.5%, but that was down from Q2’s 3.9%, which was a rebound from the first quarter (the second report is on Nov. 24, 2015, and the final is on Dec. 22, 2015). Globally, the IMF again reduced its expected 2015 growth rate, this time to 3.1% from the previous 3.3%, and it reduced the 2016 projection to 3.6% from 3.8%. German manufacturing orders for August 2015 declined 1.8%, when a 0.3% gain was expected; demand from outside the eurozone, which declined 3.7%, appeared to be the cause. China announced that its third quarter GDP increased 6.9% year-over-year, beating the 6.8% that was estimated, but it posted its slowest growth since 2009 (Q1 2009 was 6.2%), and it came in below the official 7.0% target rate (which is now being referred to as “about 7%”). The Chinese government cut its interest rate by 0.25% (to 4.35%) for the sixth time since November 2014 and cut its deposit rate to 1.5% (from 1.75%). It also lowered its reserve requirements in an effort to aid growth and stability. Saudi Arabia cut its oil price for Asia, matching other OPEC nations. A report estimated that U.S. oil production for 2016 could decline for the first time since 2008, as U.S. expenditures are cut back in response to lower oil prices. S&P Dow Jones Indices research showed that S&P 500 energy capital expenditures for the first half of 2015 declined 20.5% (from USD 104 billion to USD 83 billion). In the U.S., the September employment report had nothing good to say, as the report and revisions were both disappointing (142,000 new jobs, when 201,000 were expected), and participation fell to its lowest level since September 1977 (62.4%). The PPI for September came in lower than expected, with the year-over-year rate at -1.1% (excluding food and energy, it was up 0.8%), and the CPI was 0.0% year-over-year, with the CPI ex-food and energy at 1.9% year-over-year. The PCE came in up 0.2% year-over-year, and the Core PCE came in up 1.3%. Housing news was mixed, as the August FHFA Home Price Index missed expectations (up 0.3% when a 0.5% gain was expected), the September Existing Home Sales beat estimates, and New Home Sales came in at 468,000, when a much higher 549,000 was expected. S&P Dow Jones Indices added research and consulting company Verisk Analytics (VRSK) to the S&P 500 and removed construction machinery issue Joy Global (JOY). It also said it would add technology solutions issue Hewlett Packard Enterprise (HPE), which is being spun off by Hewlett-Packard (HPQ), 2
3) Market Attributes | U.S. Equities October 2015 after the close of business on Oct. 30, 2015, and Hudson City Bancorp (HCBK) will be removed after the close of business on Nov. 2, 2015. Hewlett-Packard will change its name to HP and remain in the S&P 500. Interest rates increased for the month, as the U.S. Fed kept rates unchanged again. The 10-year U.S. Treasury Bond closed at 2.14% (from last month’s 2.05%, year-end 2014’s 2.17%, and 2013’s 3.03%). The 30-year U.S. Treasury Bond closed at 2.92% (2.87%, 2.75%, 3.94%). The euro closed at 1.1007 (1.1165, 1.2098, 1.3756), the pound closed at 1.5427 (1.5129, 1.5582, 1.6564), the yen closed at 120.62 (119.91, 119.80, 105.20 [reverse reference, which is usually used]), and the yuan ended at 6.3161 (last month’s 6.3567, and 6.2104 prior to the Aug. 10, 2015, devaluation). Gold closed at USD 1,141.70 (1,114.40, 1,183.20, 1,204.80). Oil continued in the mid-USD 40 area and closed the month at USD 46.39 (45.45, 53.27, 98.70). U.S. pump prices increased to end the month at USD 2.228 (2.322, 2.299, 3.271). VIX, “the fear factor,” declined as the headline indices went up, closing at 15.09, which was down from last month’s 24.50. INDEX REVIEW S&P 500 For the month, the index advanced 8.30%, as all 10 sectors gained, with 420 of the S&P 500 issues increasing in price. Leading the way up were beaten-down sectors, such as materials, which did the worst in September, losing 9.55%. It rebounded 13.54% this month to perform the best; unfortunately, one month does not make a year, and the sector remained 7.50% lower YTD. Also rebounding was energy, which gained 11.25%, while oil moved up slightly but remained active in the USD mid-40 range; the sector was off 14.40% YTD, the worst of any group. Utilities moved up 1.05%, mostly helped by the continuance of low interest rates, as stability and yield were not among the preferred group this month. Consumer discretionary gained 8.99% (up 12.15% YTD, the best of any sector), as consumers were seen as being in better financial condition, and therefore more able to spend. For October, 420 issues posted gains (up an average of 9.72%), compared with the 148 that did so last month and the lonely 60 the prior month. Eighty-five issues declined for the month (an average decrease of 5.00%), down from the overwhelming 355 declines the month before and the overpowering 442 decliners the month before that. Issue movement was high, as many reacted strongly to earnings and guidance. One hundred seventy issues, one-third of the index, gained at least 10% on the month (with an average gain of 15.22%), while 15 fell at least 10% (an average loss of 14.36%). Economic data is expected to increase in importance next month, as the data-dependent Fed is seen as focusing in on the current trends for its December 2015 interest rate decision. Retail earnings will report, as the upcoming holiday season starts the day after the U.S. Thanksgiving holiday (Nov. 26, 2015; markets will be closed, and they will close at 1 p.m. the next day for “Black Friday”). Investors will focus on holiday shopping and the pressure on margins as stores compete for business. 3
4) Market Attributes | U.S. Equities October 2015 The Dow® It was a good month for the core indices, and the bigger you were, the better you did—at least as an index. The Dow posted an 8.47% October return, the best of any of the four headline indices. The problem is that while it was on top for the month, it was still on the bottom YTD, off 0.90%, as well as for the trailing year, up 1.57%. For the month, 27 of the 30 issues gained, with an average gain of 10.85%, as only three declined, with an average loss of 5.42%. Earnings dominated the trading, with some bargain hunting helping the beaten-down issues, as one-half of the issues posted double-digit gains. Chemicals and life sciences issue EI du Pont de Nemours (DD) did the best, gaining 31.5% this month; however, the issue remained off 14.2% YTD. Likewise for oil issue Chevron (CVX), which gained 15.2% and remained off 19.0% YTD, and earth-moving machinery issue Caterpillar (CAT), which gained 11.7% but was still off 20.36% YTD. Discount store operator Wal-Mart Stores (WMT), which has yet to report, fell 11.72% in October . Business machinery issue International Business Machines (IBM) and charge card issue American Express (AXP) were the others to post losses, off 3.4% and 1.2%, respectively, as both remained in the red YTD, off 12.7% and 21.3%, respectively. The Dow was off 0.90% YTD, with a wide spread between the issues. The 16 up issues had an average gain of 12.6%, and the 14 decliners had an average loss of 13.1%. Even issues in the same general field had wide returns, with Visa (V) up 20.8% YTD and American Express down 21.3% YTD, while Nike (NKE) was up 36.3% YTD and Wal-Mart was down 33.3% YTD. S&P MidCap 400 The S&P MidCap 400 posted a 6.02% gain this month, as it rebounded from its September 2015 3.38% decline and August 2015 5.73% fall. Consumer discretionary was the only sector in the index to fall, off 2.02%, as telecommunication services jumped back with a 14.75% gain, after falling 12.24% last month (not for the faint of heart). Energy also rebounded, up 10.38%, after last month’s 10.98% decline, but it remained off 19.58% YTD and 46.5% off from the June 2014 oil highs (USD 105). Breadth was positive, with 321 issues up (an average of 9.65%) and 77 down (an average decline of 7.26%). One hundred and twenty three issues gained at least 10%, as 18 fell at least 10%. Year-to-date, the S&P MidCap 400 was slightly down, off 0.53%. However, underlying the minor price change, 58% of the issues moved at least 10%, with 105 up (averaging a 24.04% gain) and 127 down (averaging a 24.98% loss). The wide spread was also evident among sectors, as health care was up 6.79%, while energy was off 19.58%. S&P SmallCap 600 The S&P SmallCap 600 posted a 6.02% gain after last month’s 3.66% fall (and August’s 5.30% decline), but it was still off 0.82% YTD. For the month, 441 issues gained (an average increase of 11.64%) and 157 declined (an average loss of 7.38%); 198 moved up at least 10% (an average of 19.14%) and 37 declined at least 10% (an average of 18.69%). Telecommunication services was the standout, up 17.45%, as the sector turned positive for 2015, up 1.12% YTD. Energy was next, gaining 13.13% for the month, but it was off 38.58% YTD and off a devastating 66.3% from June 2014. Health care gained the least for the month, up 2.85%, but it had the best gain YTD, at 12.07%, easily outshining its mid- and large-cap cousins. 4
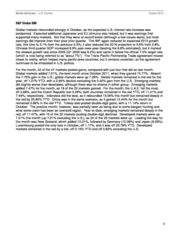
5) Market Attributes | U.S. Equities October 2015 S&P Global BMI Global markets rebounded strongly in October, as the expected U.S. interest rate increase was postponed. Expected additional Japanese and EU stimulus also helped, but it was earnings that supported many markets. Not that they were at record levels (although a few issues were), but most earnings did improve from their poor prior quarter. The IMF again reduced its expected 2015 growth rate, this time to 3.1% from the previous 3.3%; it also reduced the 2016 projection to 3.6% from 3.8%. Chinese third quarter GDP increased 6.9% year-over-year (beating the 6.8% estimated), but it marked the slowest growth rate since 2009 (Q1 2009 was 6.2%) and came in below the official 7.0% target rate (which is now being referred to as “about 7%”). The Trans-Pacific Partnership Trade agreement moved closer to reality, which helped many pacific-area countries, but it remains uncertain, as the agreement continues to be embodied in U.S. politics. For the month, 42 of the 47 markets posted gains, compared with just four that did so last month. Global markets added 7.51%, the best month since October 2011, when they gained 10.77%. Absent the 7.75% gain in the U.S., global markets were up 7.26%. Global markets remained in the red for the year, off 1.27% YTD, with a 2.94% decline excluding the 0.40% gain from the U.S. Emerging markets did slightly worse than developed, although there was no shame in either group. Emerging markets added 7.47% for the month, as 18 of the 22 markets gained. For the month, the U.A.E. fell the most, off 4.68%, and the Czech Republic lost 3.09%; both countries remained in the red YTD, off 11.01% and 7.49%, respectively. Indonesia did the best, as it rebounded 15.56% this month but remained deeply in the red by 25.80% YTD. China was in the same scenario, as it gained 12.44% for the month but remained 3.86% in the red YTD. Turkey also posted double-digit gains, with a 11.14% return in October. The positive month, however, was partially seen as being due to some bargain hunting and what some claim has been an oversold region. Year-to-date, emerging markets remained deeply in the red, off 11.47%, with 15 of the 22 markets posting double-digit declines. Developed markets were up 7.51% this month (up 7.21% excluding the U.S.), as 24 of the 25 markets were up. Leading the way for the month was New Zealand, which added 13.31%, followed by Germany (10.08%) and Japan (9.29%). Luxembourg posted the only loss in October, off 1.17%, and it was off 23.79% YTD. Developed markets remained in the red by a tick, off 0.15% YTD and off 0.82% excluding the U.S. 5
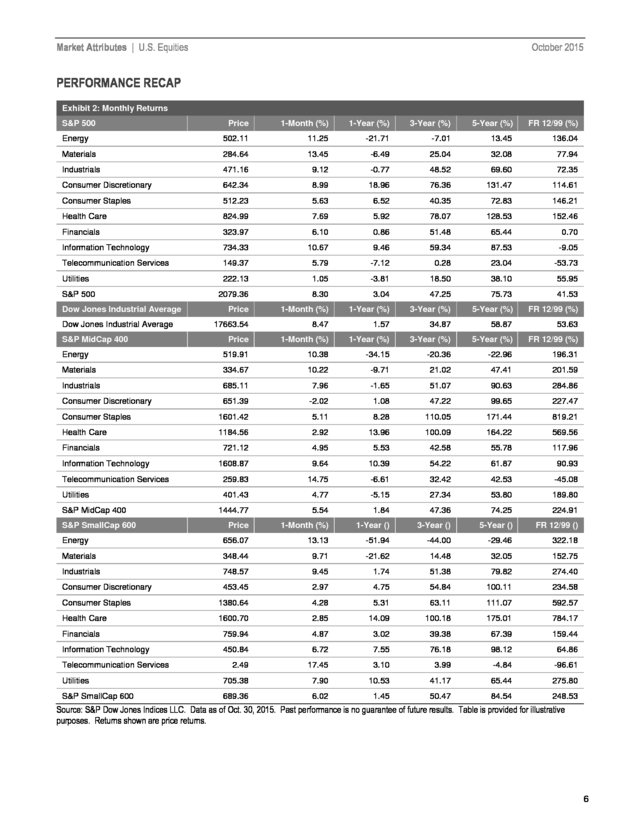
6) Market Attributes | U.S. Equities October 2015 PERFORMANCE RECAP Exhibit 2: Monthly Returns S&P 500 Price 1-Month (%) 1-Year (%) 3-Year (%) 5-Year (%) FR 12/99 (%) Energy 502.11 11.25 -21.71 -7.01 13.45 136.04 Materials 284.64 13.45 -6.49 25.04 32.08 77.94 Industrials 471.16 9.12 -0.77 48.52 69.60 72.35 Consumer Discretionary 642.34 8.99 18.96 76.36 131.47 114.61 Consumer Staples 512.23 5.63 6.52 40.35 72.83 146.21 Health Care 824.99 7.69 5.92 78.07 128.53 152.46 Financials 323.97 6.10 0.86 51.48 65.44 0.70 Information Technology 734.33 10.67 9.46 59.34 87.53 -9.05 Telecommunication Services 149.37 5.79 -7.12 0.28 23.04 -53.73 Utilities 222.13 1.05 -3.81 18.50 38.10 55.95 S&P 500 Dow Jones Industrial Average Dow Jones Industrial Average 2079.36 8.30 3.04 47.25 75.73 41.53 Price 1-Month (%) 1-Year (%) 3-Year (%) 5-Year (%) FR 12/99 (%) 17663.54 8.47 1.57 34.87 58.87 53.63 Price 1-Month (%) 1-Year (%) 3-Year (%) 5-Year (%) FR 12/99 (%) Energy 519.91 10.38 -34.15 -20.36 -22.96 196.31 Materials 334.67 10.22 -9.71 21.02 47.41 201.59 Industrials 685.11 7.96 -1.65 51.07 90.63 284.86 Consumer Discretionary 651.39 -2.02 1.08 47.22 99.65 227.47 Consumer Staples 1601.42 5.11 8.28 110.05 171.44 819.21 Health Care 1184.56 2.92 13.96 100.09 164.22 569.56 721.12 4.95 5.53 42.58 55.78 117.96 1608.87 9.64 10.39 54.22 61.87 90.93 Telecommunication Services 259.83 14.75 -6.61 32.42 42.53 -45.08 Utilities 401.43 4.77 -5.15 27.34 53.80 189.80 1444.77 5.54 1.84 47.36 74.25 224.91 S&P MidCap 400 Financials Information Technology S&P MidCap 400 S&P SmallCap 600 Price 1-Month (%) 1-Year () 3-Year () 5-Year () FR 12/99 () Energy 656.07 13.13 -51.94 -44.00 -29.46 322.18 Materials 348.44 9.71 -21.62 14.48 32.05 152.75 Industrials 748.57 9.45 1.74 51.38 79.82 274.40 Consumer Discretionary 453.45 2.97 4.75 54.84 100.11 234.58 Consumer Staples 1380.64 4.28 5.31 63.11 111.07 592.57 Health Care 1600.70 2.85 14.09 100.18 175.01 784.17 Financials 759.94 4.87 3.02 39.38 67.39 159.44 Information Technology 450.84 6.72 7.55 76.18 98.12 64.86 2.49 17.45 3.10 3.99 -4.84 -96.61 Utilities 705.38 7.90 10.53 41.17 65.44 275.80 S&P SmallCap 600 689.36 6.02 1.45 50.47 84.54 248.53 Telecommunication Services Source: S&P Dow Jones Indices LLC. Data as of Oct. 30, 2015. Past performance is no guarantee of future results. Table is provided for illustrative purposes. Returns shown are price returns. 6
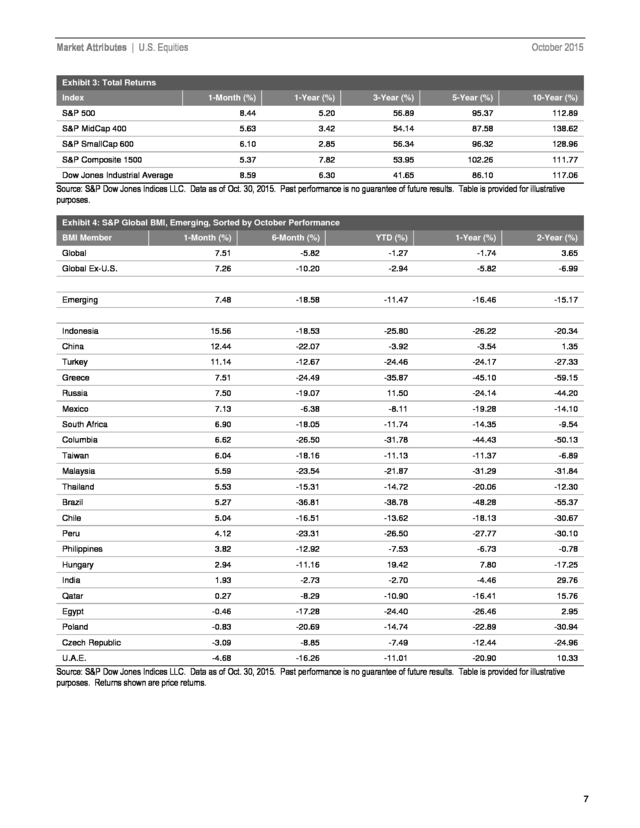
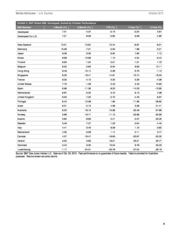
7) Market Attributes | U.S. Equities October 2015 Exhibit 3: Total Returns Index 1-Month (%) 1-Year (%) 3-Year (%) 5-Year (%) 10-Year (%) S&P 500 8.44 5.20 56.89 95.37 112.89 S&P MidCap 400 5.63 3.42 54.14 87.58 138.62 S&P SmallCap 600 6.10 2.85 56.34 96.32 128.96 S&P Composite 1500 5.37 7.82 53.95 102.26 111.77 Dow Jones Industrial Average 8.59 6.30 41.65 86.10 117.06 Source: S&P Dow Jones Indices LLC. Data as of Oct. 30, 2015. Past performance is no guarantee of future results. Table is provided for illustrative purposes. Exhibit 4: S&P Global BMI, Emerging, Sorted by October Performance BMI Member 1-Month (%) 6-Month (%) YTD (%) 1-Year (%) 2-Year (%) Global 7.51 -5.82 -1.27 -1.74 3.65 Global Ex-U.S. 7.26 -10.20 -2.94 -5.82 -6.99 Emerging 7.48 -18.58 -11.47 -16.46 -15.17 Indonesia 15.56 -18.53 -25.80 -26.22 -20.34 China 12.44 -22.07 -3.92 -3.54 1.35 Turkey 11.14 -12.67 -24.46 -24.17 -27.33 Greece 7.51 -24.49 -35.87 -45.10 -59.15 Russia 7.50 -19.07 11.50 -24.14 -44.20 Mexico 7.13 -6.38 -8.11 -19.28 -14.10 South Africa 6.90 -18.05 -11.74 -14.35 -9.54 Columbia 6.62 -26.50 -31.78 -44.43 -50.13 Taiwan 6.04 -18.16 -11.13 -11.37 -6.89 Malaysia 5.59 -23.54 -21.87 -31.29 -31.84 Thailand 5.53 -15.31 -14.72 -20.06 -12.30 Brazil 5.27 -36.81 -38.78 -48.28 -55.37 Chile 5.04 -16.51 -13.62 -18.13 -30.67 Peru 4.12 -23.31 -26.50 -27.77 -30.10 Philippines 3.82 -12.92 -7.53 -6.73 -0.78 Hungary 2.94 -11.16 19.42 7.80 -17.25 India 1.93 -2.73 -2.70 -4.46 29.76 Qatar 0.27 -8.29 -10.90 -16.41 15.76 Egypt -0.46 -17.28 -24.40 -26.46 2.95 Poland -0.83 -20.69 -14.74 -22.89 -30.94 Czech Republic -3.09 -8.85 -7.49 -12.44 -24.96 U.A.E. -4.68 -16.26 -11.01 -20.90 10.33 Source: S&P Dow Jones Indices LLC. Data as of Oct. 30, 2015. Past performance is no guarantee of future results. Table is provided for illustrative purposes. Returns shown are price returns. 7
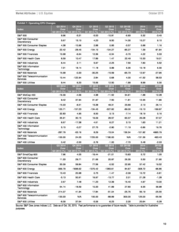
8) Market Attributes | U.S. Equities October 2015 Exhibit 5: S&P Global BMI, Developed, Sorted by October Performance BMI Member 1-Month (%) 6-Month (%) YTD (%) 1-Year (%) 2-Year (%) Developed 7.51 -4.37 -0.15 -0.04 5.87 Developed Ex-U.S. 7.21 -8.09 -0.82 -3.09 -4.95 New Zealand 13.31 -10.64 -10.44 -6.87 -8.51 Germany 10.08 -7.01 0.00 1.89 -5.21 Japan 9.29 -3.30 8.94 7.80 7.12 Korea 8.98 -10.99 1.10 -4.04 -9.44 Finland 8.65 -1.04 0.01 -1.31 -1.72 Belgium 8.52 -0.80 6.54 8.65 12.11 Hong Kong 8.48 -16.14 -2.26 -5.75 -1.12 Singapore 8.33 -18.41 -14.91 -15.74 -18.20 France 8.30 -4.13 5.20 3.35 -4.38 United States 7.75 -1.28 0.40 2.43 15.83 Spain 6.96 -11.36 -9.22 -14.23 -12.95 Netherlands 6.87 -5.25 3.72 6.13 4.38 United Kingdom 6.52 -7.22 -2.72 -4.45 -6.97 Portugal 6.42 -12.08 1.90 -11.56 -28.92 Israel 6.31 -2.16 4.39 3.26 21.41 Australia 6.20 -18.16 -15.59 -23.49 -27.68 Norway 5.88 -18.71 -11.13 -23.98 -32.99 Austria 5.82 -8.83 2.41 -2.37 -20.26 Sweden 5.48 -7.27 -1.23 -2.64 -4.45 Italy 4.41 -3.45 9.09 1.72 -3.62 Switzerland 4.30 -6.08 1.14 0.11 3.77 Canada 4.27 -18.47 -18.63 -20.87 -20.32 Ireland 3.32 5.63 19.01 25.01 26.77 Denmark 0.42 -3.35 15.04 9.79 32.20 -1.17 -24.31 -23.79 -27.04 -28.18 Luxembourg Source: S&P Dow Jones Indices LLC. Data as of Oct. 30, 2015. Past performance is no guarantee of future results. Table is provided for illustrative purposes. Returns shown are price returns. 8
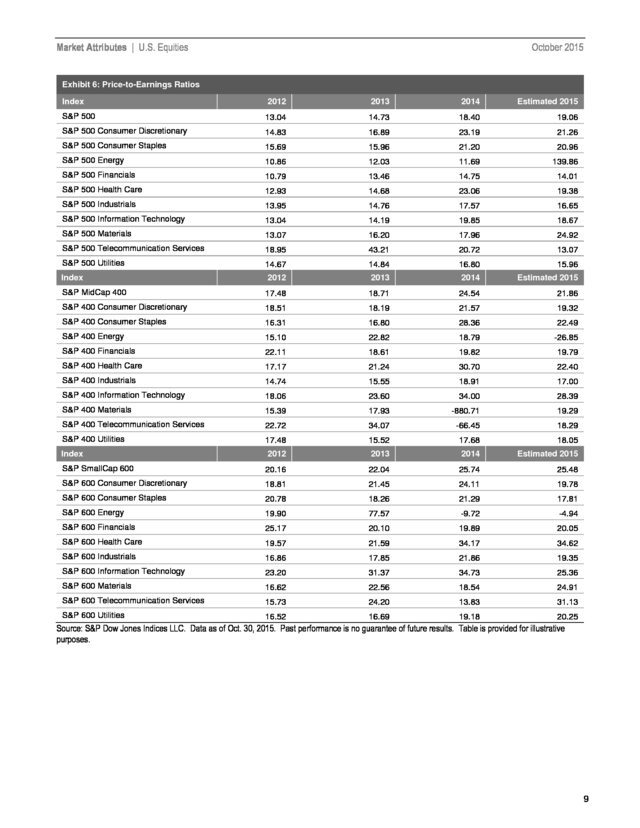
9) Market Attributes | U.S. Equities October 2015 Exhibit 6: Price-to-Earnings Ratios Index 2012 2013 2014 Estimated 2015 S&P 500 13.04 14.73 18.40 19.06 S&P 500 Consumer Discretionary 14.83 16.89 23.19 21.26 S&P 500 Consumer Staples 15.69 15.96 21.20 20.96 S&P 500 Energy 10.86 12.03 11.69 139.86 S&P 500 Financials 10.79 13.46 14.75 14.01 S&P 500 Health Care 12.93 14.68 23.06 19.38 S&P 500 Industrials 13.95 14.76 17.57 16.65 S&P 500 Information Technology 13.04 14.19 19.85 18.67 S&P 500 Materials 13.07 16.20 17.96 24.92 S&P 500 Telecommunication Services 18.95 43.21 20.72 13.07 S&P 500 Utilities 14.67 14.84 16.80 15.96 Index 2012 2013 2014 Estimated 2015 S&P MidCap 400 17.48 18.71 24.54 21.86 S&P 400 Consumer Discretionary 18.51 18.19 21.57 19.32 S&P 400 Consumer Staples 16.31 16.80 28.36 22.49 S&P 400 Energy 15.10 22.82 18.79 -26.85 S&P 400 Financials 22.11 18.61 19.82 19.79 S&P 400 Health Care 17.17 21.24 30.70 22.40 S&P 400 Industrials 14.74 15.55 18.91 17.00 S&P 400 Information Technology 18.06 23.60 34.00 28.39 S&P 400 Materials 15.39 17.93 -880.71 19.29 S&P 400 Telecommunication Services 22.72 34.07 -66.45 18.29 S&P 400 Utilities 17.48 15.52 17.68 18.05 Index 2012 2013 2014 Estimated 2015 S&P SmallCap 600 20.16 22.04 25.74 25.48 S&P 600 Consumer Discretionary 18.81 21.45 24.11 19.78 S&P 600 Consumer Staples 20.78 18.26 21.29 17.81 S&P 600 Energy 19.90 77.57 -9.72 -4.94 S&P 600 Financials 25.17 20.10 19.89 20.05 S&P 600 Health Care 19.57 21.59 34.17 34.62 S&P 600 Industrials 16.86 17.85 21.86 19.35 S&P 600 Information Technology 23.20 31.37 34.73 25.36 S&P 600 Materials 16.62 22.56 18.54 24.91 S&P 600 Telecommunication Services 15.73 24.20 13.83 31.13 S&P 600 Utilities 16.52 16.69 19.18 20.25 Source: S&P Dow Jones Indices LLC. Data as of Oct. 30, 2015. Past performance is no guarantee of future results. Table is provided for illustrative purposes. 9
10) Market Attributes | U.S. Equities October 2015 Exhibit 7: Operating EPS Changes Q3 2014 Over Q3 2013 (%) 9.96 Q4 2014 Over Q4 2013 (%) -5.31 Q1 2015 Over Q1 2014 (%) -5.53 Q2 2015 Over Q2 2014 (%) -10.91 2014 Over 2013 (%) 5.32 2015E Over 2014 (%) -3.45 S&P 500 Consumer Discretionary 5.67 15.10 4.23 9.50 14.35 10.27 9.10 S&P 500 Consumer Staples 4.38 -10.96 2.88 0.95 -3.57 0.88 1.16 S&P 500 Energy 22.42 -28.45 S&P 500 Financials 10.68 -6.64 -104.10 -104.27 -85.27 1.39 -91.64 12.36 -0.34 -0.70 4.22 5.33 S&P 500 Health Care 8.59 10.47 17.89 1.47 22.49 10.33 19.01 S&P 500 Industrials S&P 500 Information Technology 8.44 2.11 5.97 -2.25 7.50 7.80 5.52 7.31 18.14 11.18 3.99 6.35 10.18 6.30 S&P 500 Materials 15.68 -0.33 -30.25 -15.59 -65.73 12.97 -27.95 S&P 500 Telecommunication Services 10.44 -122.94 2.84 0.68 4.00 -41.52 58.53 9.44 Q3 2014 Over Q3 2013 (%) -16.09 6.20 Q4 2014 Over Q4 2013 (%) -4.66 15.66 Q1 2015 Over Q1 2014 (%) 4.98 12.50 Q2 2015 Over Q2 2014 (%) -11.52 -1.99 Q3 2015E Over Q3 2014 (%) 34.61 8.99 2014 Over 2013 (%) -1.88 5.30 2015E Over 2014 (%) 12.28 9.42 37.94 31.97 7.50 11.81 12.35 11.66 Index S&P 500 S&P 500 Utilities Index S&P MidCap 400 S&P 400 Consumer Discretionary Q3 2015E Over Q3 2014 (%) -6.93 S&P 400 Consumer Staples -15.03 -8.51 15.38 48.31 23.89 2.13 26.14 S&P 400 Energy 120.71 -157.23 -134.45 -327.82 -89.00 -16.13 -169.97 S&P 400 Financials 32.83 4.95 8.50 3.13 -7.14 18.19 0.16 S&P 400 Health Care 35.91 30.15 16.09 28.57 60.37 26.08 37.07 S&P 400 Industrials 8.67 -17.38 4.61 6.27 3.15 1.63 11.21 S&P 400 Information Technology 5.15 -0.27 27.75 -2.90 11.19 -0.86 19.76 S&P 400 Materials -287.79 -63.16 8.29 -15.04 136.34 -101.92 4665.79 S&P 400 Telecommunication Services -100.00 24.05 1720.00 1190.00 N/A -131.36 463.43 0.42 Q3 2014 Over Q3 2013 (%) 7.96 -2.00 Q4 2014 Over Q4 2013 (%) 4.05 -3.76 Q1 2015 Over Q1 2014 (%) -16.44 -1.00 Q2 2015 Over Q2 2014 (%) -21.01 -7.70 Q3 2015E Over Q3 2014 (%) 15.63 5.48 2014 Over 2013 (%) 5.72 -2.03 2015E Over 2014 (%) 1.05 S&P 600 Consumer Discretionary 11.33 29.71 21.66 20.97 26.35 5.50 21.90 S&P 600 Consumer Staples 30.09 59.84 77.56 -0.52 22.95 37.42 19.52 -399.79 -1698.62 -1370.42 -1383.61 84.67 -308.72 -96.86 S&P 600 Financials 13.43 20.98 0.75 -1.47 -2.09 10.72 -0.81 S&P 600 Health Care S&P 400 Utilities Index S&P SmallCap 600 S&P 600 Energy -5.13 50.91 16.97 -13.77 2.01 21.28 -1.28 S&P 600 Industrials 2.67 7.48 11.23 12.39 16.40 4.97 13.00 S&P 600 Information Technology 54.14 -18.59 10.33 41.89 27.80 9.35 36.98 214.07 41.94 17.84 -51.04 -25.76 56.19 -25.55 -133.33 N/A 100.00 -88.89 300.00 125.00 -55.56 -8.09 37.64 -5.06 -6.23 2.05 20.64 -5.28 S&P 600 Materials S&P 600 Telecommunication Services S&P 600 Utilities Source: S&P Dow Jones Indices LLC. Data as of Oct. 30, 2015. Past performance is no guarantee of future results. Table is provided for illustrative purposes. 10
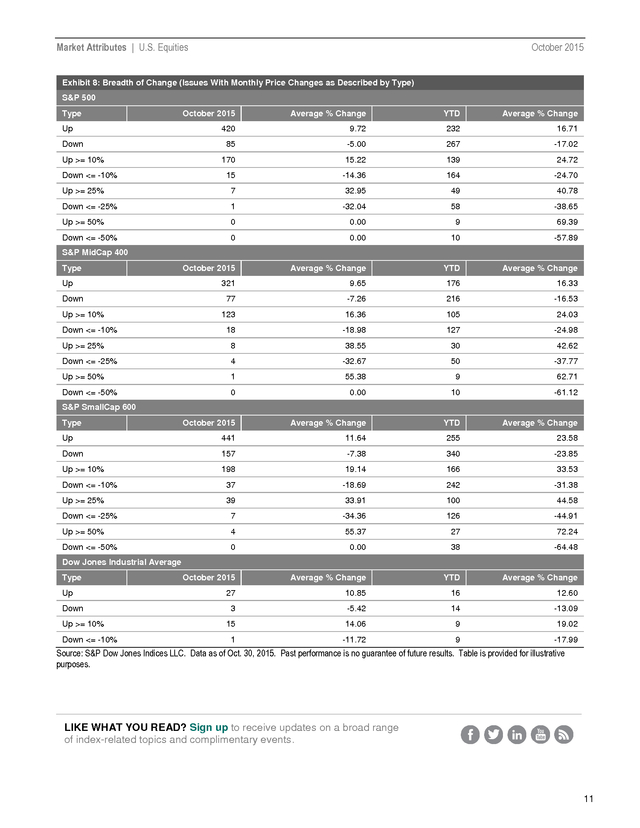
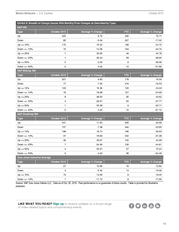
11) Market Attributes | U.S. Equities October 2015 Exhibit 8: Breadth of Change (Issues With Monthly Price Changes as Described by Type) S&P 500 Type Up Down October 2015 Average % Change YTD Average % Change 420 9.72 232 16.71 85 -5.00 267 -17.02 170 15.22 139 24.72 15 -14.36 164 -24.70 Up >= 25% 7 32.95 49 40.78 Down <= -25% 1 -32.04 58 -38.65 Up >= 50% 0 0.00 9 69.39 Down <= -50% 0 0.00 10 -57.89 October 2015 Average % Change YTD Average % Change 321 9.65 176 16.33 Up >= 10% Down <= -10% S&P MidCap 400 Type Up Down 77 -7.26 216 -16.53 123 16.36 105 24.03 18 -18.98 127 -24.98 Up >= 25% 8 38.55 30 42.62 Down <= -25% 4 -32.67 50 -37.77 Up >= 50% 1 55.38 9 62.71 Down <= -50% 0 0.00 10 -61.12 October 2015 Average % Change YTD Average % Change Up 441 11.64 255 23.58 Down 157 -7.38 340 -23.85 Up >= 10% 198 19.14 166 33.53 Down <= -10% 37 -18.69 242 -31.38 Up >= 25% 39 33.91 100 44.58 Down <= -25% 7 -34.36 126 -44.91 Up >= 50% 4 55.37 27 72.24 Down <= -50% 0 0.00 38 -64.48 October 2015 Average % Change YTD Average % Change 27 10.85 16 12.60 Up >= 10% Down <= -10% S&P SmallCap 600 Type Dow Jones Industrial Average Type Up Down Up >= 10% Down <= -10% 3 -5.42 14 -13.09 15 14.06 9 19.02 1 -11.72 9 -17.99 Source: S&P Dow Jones Indices LLC. Data as of Oct. 30, 2015. Past performance is no guarantee of future results. Table is provided for illustrative purposes. LIKE WHAT YOU READ? Sign up to receive updates on a broad range of index-related topics and complimentary events. 11
12) Market Attributes | U.S. Equities October 2015 GENERAL DISCLAIMER ® © 2015 by S&P Dow Jones Indices LLC, a part of McGraw Hill Financial, Inc. All rights reserved. Standard & Poor’s and ® S&P are registered trademarks of Standard & Poor’s Financial Services LLC (“S&P”), a subsidiary of McGraw Hill Financial. ® Dow Jones is a registered trademark of Dow Jones Trademark Holdings LLC (“Dow Jones”). Trademarks have been licensed to S&P Dow Jones Indices LLC. Redistribution, reproduction and/or photocopying in whole or in part are prohibited without written permission. This document does not constitute an offer of services in jurisdictions where S&P Dow Jones Indices LLC, Dow Jones, S&P or their respective affiliates (collectively “S&P Dow Jones Indices”) do not have the necessary licenses. All information provided by S&P Dow Jones Indices is impersonal and not tailored to the needs of any person, entity or group of persons. S&P Dow Jones Indices receives compensation in connection with licensing its indices to third parties. Past performance of an index is not a guarantee of future results It is not possible to invest directly in an index. Exposure to an asset class represented by an index is available through investable instruments based on that index. S&P Dow Jones Indices does not sponsor, endorse, sell, promote or manage any investment fund or other investment vehicle that is offered by third parties and that seeks to provide an investment return based on the performance of any index. S&P Dow Jones Indices makes no assurance that investment products based on the index will accurately track index performance or provide positive investment returns. S&P Dow Jones Indices LLC is not an investment advisor, and S&P Dow Jones Indices makes no representation regarding the advisability of investing in any such investment fund or other investment vehicle. A decision to invest in any such investment fund or other investment vehicle should not be made in reliance on any of the statements set forth in this document. Prospective investors are advised to make an investment in any such fund or other vehicle only after carefully considering the risks associated with investing in such funds, as detailed in an offering memorandum or similar document that is prepared by or on behalf of the issuer of the investment fund or other vehicle. Inclusion of a security within an index is not a recommendation by S&P Dow Jones Indices to buy, sell, or hold such security, nor is it considered to be investment advice. Closing prices for S&P US benchmark indices and Dow Jones US benchmark indices are calculated by S&P Dow Jones Indices based on the closing price of the individual constituents of the index as set by their primary exchange. Closing prices are received by S&P Dow Jones Indices from one of its third party vendors and verified by comparing them with prices from an alternative vendor. The vendors receive the closing price from the primary exchanges. Real-time intraday prices are calculated similarly without a second verification.] These materials have been prepared solely for informational purposes based upon information generally available to the public and from sources believed to be reliable. No content contained in these materials (including index data, ratings, credit-related analyses and data, research, valuations, model, software or other application or output therefrom) or any part thereof (Content) may be modified, reverse-engineered, reproduced or distributed in any form or by any means, or stored in a database or retrieval system, without the prior written permission of S&P Dow Jones Indices. The Content shall not be used for any unlawful or unauthorized purposes. S&P Dow Jones Indices and its third-party data providers and licensors (collectively “S&P Dow Jones Indices Parties”) do not guarantee the accuracy, completeness, timeliness or availability of the Content. S&P Dow Jones Indices Parties are not responsible for any errors or omissions, regardless of the cause, for the results obtained from the use of the Content. The Content is provided on an “as is” basis. S&P DOW JONES INDICES PARTIES DISCLAIM ANY AND ALL EXPRESS OR IMPLIED WARRANTIES, INCLUDING, BUT NOT LIMITED TO, ANY WARRANTIES OF MERCHANTABILITY OR FITNESS FOR A PARTICULAR PURPOSE OR USE, FREEDOM FROM BUGS, SOFTWARE ERRORS OR DEFECTS, THAT THE CONTENT’S FUNCTIONING WILL BE UNINTERRUPTED OR THAT THE CONTENT WILL OPERATE WITH ANY SOFTWARE OR HARDWARE CONFIGURATION. In no event shall S&P Dow Jones Indices Parties be liable to any party for any direct, indirect, incidental, exemplary, compensatory, punitive, special or consequential damages, costs, expenses, legal fees, or losses (including, without limitation, lost income or lost profits and opportunity costs) in connection with any use of the Content even if advised of the possibility of such damages. S&P Dow Jones Indices keeps certain activities of its business units separate from each other in order to preserve the independence and objectivity of their respective activities. As a result, certain business units of S&P Dow Jones Indices may have information that is not available to other business units. S&P Dow Jones Indices has established policies and procedures to maintain the confidentiality of certain non-public information received in connection with each analytical process. In addition, S&P Dow Jones Indices provides a wide range of services to, or relating to, many organizations, including issuers of securities, investment advisers, broker-dealers, investment banks, other financial institutions and financial intermediaries, and accordingly may receive fees or other economic benefits from those organizations, including organizations whose securities or services they may recommend, rate, include in model portfolios, evaluate or otherwise address. 12