Severity: Notice
Message: Undefined variable: content_category
Filename: user/transcript.php
Line Number: 106
Severity: Warning
Message: Invalid argument supplied for foreach()
Filename: user/transcript.php
Line Number: 106


1) Investment Review and Outlook March 31, 2016 Review and Outlook “There was a wide range of emotions felt by all - from elation and joy, to pain and fear. “ ― Roald Amundsen (1872-1928), Norwegian explorer, and first man to reach the South Pole in 1911. Amundsen’s description of his team’s reaction to reaching the South Pole is an appropriate way to describe the extreme range of emotions felt by investors during the first quarter. U.S. equities experienced both a sharp correction and a rapid recovery. The S&P 500 dove 10.5% through mid-February and then soared 13% in the final weeks, closing up 1.4%. Small caps trailed large caps, and value-oriented stocks outpaced growth stocks. Utilities and consumer staples pushed the market higher, while healthcare and technology stocks held the averages back. International markets provoked similar investor reaction as global equities delivered mixed results. A snap back in emerging markets after four consecutive quarters of decline pushed the MSCI Emerging Markets Index up nearly 6%, while EAFE dropped 3%. International crosscurrents were created by favorable monetary news out of the European Central Bank being offset by continued concerns over downward revisions in global growth. These divisive pressures were further exaggerated by Japan’s adoption of negative interest rates, China’s continuing struggles to shift from a manufacturing to a consumer-led economy, and Britain’s June referendum on whether to stay or leave the European Union – appropriately referred to as “Brexit”. Interest rates dropped in the quarter on concerns over continued economic sluggishness and an increasing belief that the Fed will delay additional hikes in the Fed Funds rate. The ten year Treasury closed at 1.83%, down from 2.31%. BBB-rated corporate yield spreads versus Treasuries widened to over 240 basis points in early February and then abruptly tightened to 195 in late March – finishing up where they started the year. Overall, bonds provided much needed stability during a shaky period, as all major taxable and municipal indices posted positive returns. Commodities joined in the market mayhem as metals, energy and agricultural products swung wildly. In the end the CRB Index of 23 commodities closed the quarter down 2.25%. However, gold served its role as an antidote to investor fear by jumping over 16%. Energy markets went wild in the first quarter, with oil closing at $38.50 per barrel, up 4.75%. However, the commodity traded as low as $28 and as high as $42 per barrel. This 40% swing proved very unsettling for investors. Unfortunately economic fundamentals were not the only cause of the “wide range of emotions” during the quarter. The escalating circus-like presidential primaries, Apple’s fight with the government over privacy, and the Brussels terrorist attacks added to an already anxious environment. Overall, the first quarter followed a very jagged path with sharp declines and strong recoveries. In the end most markets closed slightly higher than where they started the year. However, despite this modestly positive beginning, the broader markets have been disappointing for the trailing year. As the chart below shows the bright spots experienced by large cap stocks and bonds were more than offset by the decline in other domestic and international markets. These declines dragged balanced portfolios into negative territory for the trailing twelve months.
2) Page 2 Major Market Returns One Year Ending March 31, 2016 6% 2% 2.9% 1.8% 1.8% 2.0% Barclays GCI Barclays Interm. Credit Barclays Agg -0.3% -2% -4.0% -6% -10% -14% 2.1% -9.8% -8.3% -12.0% S&P 500 Russell 3000 Russell Mid Cap Russell 2000 MSCI EAFE International U.S. Equities MSCI Emerging Mkts Barclays 1-10 Muni Fixed Income Sources: FactSet; Russell; Barclays; Bloomberg It continues to be an exhausting ride filled with many emotions – ranging from “elation and joy, to pain and fear”. However, we believe the future will present positive opportunities. Economic and Financial Markets Outlook “There are some things you can only learn in a storm”―Sebastian Junger, The Perfect Storm In the chaos of the first quarter we saw signs that give us confidence in our positive economic growth forecast and our sanguine view of the financial markets. A key turning point came in mid-February when the Fed made it clear that its pace and magnitude of future interest rate hikes is expected to be much slower than initially indicated. Janet Yellen’s dovish “Fed speak” helped minimize concerns over the weakening U.S. dollar. This action turned a current corporate profit headwind into a future earnings tailwind. On a trade-weighted basis the U.S. dollar dropped a manageable 4.6% in the first quarter. The softening of the dollar helped alleviate pressures that were building between a tightening U.S. Fed and global central banks such as the ECB and the Bank of Japan that are pursuing “easy money” strategies. This global divergence in monetary policy was creating significant uncertainty and raising the potential for severe currency dislocations. Given that oil is priced on the global market in U.S. dollars, the opportunity for currency stability allowed investors, policymakers, and corporate managements to gain confidence that a path to a better balance of supply and demand is achievable in energy as well as other global commodities. These positive developments are expected to have a favorable impact on corporate earnings – especially in the second half of the year. Over 200 companies in the S&P 500 derive 50% or more of their revenues outside of the U.S. The majority of these companies are found in the largest and most influential economic sectors, including health care, technology, energy, and industrials. Over the past 18 months the sharply rising dollar has penalized corporate earnings. During the first quarter one in five S&P companies issued earnings guidance below consensus earnings estimates. Their primary rational for lower expectations was currency related. This lower guidance set off a cascade of negative earnings revisions among high profile companies such as Alcoa, Johnson & Johnson, IBM, and several pharmaceutical companies. Analysts expect year-over-year first quarter profits to slide 8.5% - marking the fourth consecutive quarterly earnings contraction. Although this seems troubling on the eve of earnings season, the second half of 2016 is expected to experience a combination of more stable currency valuations and favorable year-over-year profit comparisons. An improvement in the earnings outlook, in an environment of reasonable valuations is expected to benefit investors that are focused on underlying fundamentals. In addition, corporate dividends remain appealing as over 50% of S&P 500 stocks have dividend yields greater than the yield on the 10year Treasury bond. This is more than twice as many companies as in 2013 when only 23% of S&P stocks had dividend yields greater than the bellwether Treasury yield.
3) Page 3 At the macro level, the U.S. is performing better than most global economies. The March employment report showed the addition of 215,000 new jobs, an uptick in the labor participation rate, and a marginal improvement in wages. Lower personal debt levels, declining gasoline prices, employment and wage lift, and improvement in the housing market support higher consumer spending - which represents nearly 70% of GDP. How consumers feel about their economic condition drives consumption and spending. The University of Michigan Consumer Sentiment Index, which measures personal finances, employment stability, and future buying plans moved higher in March versus year ago levels. This positive trend supports the consensus view that consumer spending is expected to rise 3% in 2016. The March manufacturing index increase was the highest reading since late 2014, and strong balance sheets and cash positions continue to enable U.S. corporations to engage in shareholder-friendly initiatives, such as dividend increases, share repurchases, and M&A activity. While we acknowledge that economic “storms” will pop up throughout the remainder of the year, we don’t believe they will be of a magnitude to derail the long term positive trajectory of economic growth or diminish opportunities in financial markets. Small vs. Large Caps: The David and Goliath of Equities “Giants are not what we think they are. The same qualities that appear to give them strength are often the sources of great weakness.” --- Malcolm Gladwell, David and Goliath: Underdogs, Misfits, and the Art of Battling Giants The first quarter marked the seventh anniversary of the equity bull market that began on March 9, 2009. The world has changed significantly since that Monday morning when the market was resuscitated and brought back to life. We were living in a time when the latest technology was the iPhone 3 and Apple was launching the first iPad. Breaking news included the “Miracle on the Hudson” and the arrest of a previously little known financial advisor named Bernie Madoff. The Dow was trading at 6,500, the S&P 500 eerily bottomed at 666, and the 10-year Treasury yielded 3.10%. Since its beginning the bull market has taken the Dow and S&P 500 up nearly 250%. However, the market’s rise has come with several bumps and bruises along the way. Over its seven year life, the S&P has experienced 14 selloffs of greater than 5% - roughly two scary “air pockets” per year. There have been six drops of over 10%, with two of those greater than 15%. The market’s ride higher has been financially rewarding; but it has come with a heavy dose of turbulence. Despite the triumphant rise of the Dow and S&P 500, all segments of the U.S. equity markets have not enjoyed the full fruits of the bull market. This is particularly true of small cap stocks. As the table below shows, large caps have outpaced small caps since the market’s bottom, and even more so in recent years. Major Equity Indexes By Capitalization Index Russell Mega Cap 50 S &P 500 Russell Mid Cap Russell 2000 Russell Mic ro Cap Median Market Cap (Bil.) $109.6 $17.6 $3.6 $1.7 $0.7 Annualized Returns Ending 3/31/16 Since 1 Year 3 Year 5 Year 3/09/2009 5.87 1.77 -4.04 -9.76 -13.05 11.80 11.77 10.45 7.91 6.34 11.83 11.01 10.30 7.70 6.61 22.92 21.91 19.51 19.40 18.07 Source: S&P, Russell In the initial stage of the bull market small cap stocks outpaced large caps by a wide margin as investors sought risk-based assets over mature large cap stocks. This created a liquidity squeeze in small caps that resulted in relative outperformance. In the twelve months following the market’s bottom the S&P 500 jumped 68%, with the Russell 2000 surging by nearly 100%. In recent years the trend has reversed, and large caps have outpaced small caps significantly. Despite the recent underperformance, we believe diversification in small caps continues to be appropriate. Capitalization leadership moves in cycles. Although over the past three and five year periods large caps have outpaced small caps, there are
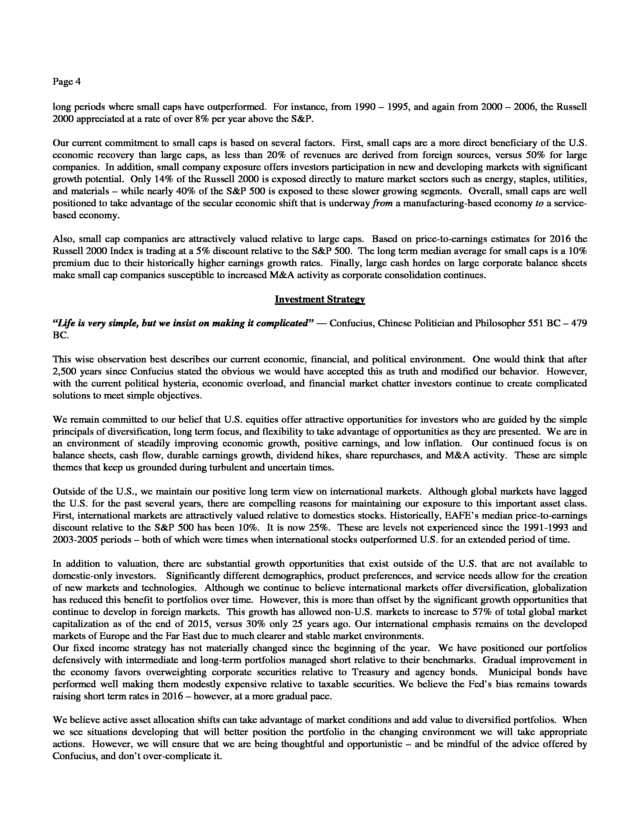
4) Page 4 long periods where small caps have outperformed. For instance, from 1990 – 1995, and again from 2000 – 2006, the Russell 2000 appreciated at a rate of over 8% per year above the S&P. Our current commitment to small caps is based on several factors. First, small caps are a more direct beneficiary of the U.S. economic recovery than large caps, as less than 20% of revenues are derived from foreign sources, versus 50% for large companies. In addition, small company exposure offers investors participation in new and developing markets with significant growth potential. Only 14% of the Russell 2000 is exposed directly to mature market sectors such as energy, staples, utilities, and materials – while nearly 40% of the S&P 500 is exposed to these slower growing segments. Overall, small caps are well positioned to take advantage of the secular economic shift that is underway from a manufacturing-based economy to a servicebased economy. Also, small cap companies are attractively valued relative to large caps. Based on price-to-earnings estimates for 2016 the Russell 2000 Index is trading at a 5% discount relative to the S&P 500. The long term median average for small caps is a 10% premium due to their historically higher earnings growth rates. Finally, large cash hordes on large corporate balance sheets make small cap companies susceptible to increased M&A activity as corporate consolidation continues. Investment Strategy “Life is very simple, but we insist on making it complicated” ― Confucius, Chinese Politician and Philosopher 551 BC – 479 BC. This wise observation best describes our current economic, financial, and political environment. One would think that after 2,500 years since Confucius stated the obvious we would have accepted this as truth and modified our behavior. However, with the current political hysteria, economic overload, and financial market chatter investors continue to create complicated solutions to meet simple objectives. We remain committed to our belief that U.S. equities offer attractive opportunities for investors who are guided by the simple principals of diversification, long term focus, and flexibility to take advantage of opportunities as they are presented. We are in an environment of steadily improving economic growth, positive earnings, and low inflation. Our continued focus is on balance sheets, cash flow, durable earnings growth, dividend hikes, share repurchases, and M&A activity. These are simple themes that keep us grounded during turbulent and uncertain times. Outside of the U.S., we maintain our positive long term view on international markets. Although global markets have lagged the U.S. for the past several years, there are compelling reasons for maintaining our exposure to this important asset class. First, international markets are attractively valued relative to domestics stocks. Historically, EAFE’s median price-to-earnings discount relative to the S&P 500 has been 10%. It is now 25%. These are levels not experienced since the 1991-1993 and 2003-2005 periods – both of which were times when international stocks outperformed U.S. for an extended period of time. In addition to valuation, there are substantial growth opportunities that exist outside of the U.S. that are not available to domestic-only investors. Significantly different demographics, product preferences, and service needs allow for the creation of new markets and technologies. Although we continue to believe international markets offer diversification, globalization has reduced this benefit to portfolios over time. However, this is more than offset by the significant growth opportunities that continue to develop in foreign markets. This growth has allowed non-U.S. markets to increase to 57% of total global market capitalization as of the end of 2015, versus 30% only 25 years ago. Our international emphasis remains on the developed markets of Europe and the Far East due to much clearer and stable market environments. Our fixed income strategy has not materially changed since the beginning of the year. We have positioned our portfolios defensively with intermediate and long-term portfolios managed short relative to their benchmarks. Gradual improvement in the economy favors overweighting corporate securities relative to Treasury and agency bonds. Municipal bonds have performed well making them modestly expensive relative to taxable securities. We believe the Fed’s bias remains towards raising short term rates in 2016 – however, at a more gradual pace. We believe active asset allocation shifts can take advantage of market conditions and add value to diversified portfolios. When we see situations developing that will better position the portfolio in the changing environment we will take appropriate actions. However, we will ensure that we are being thoughtful and opportunistic – and be mindful of the advice offered by Confucius, and don’t over-complicate it.
5) Page 5 The opinions contained in the preceding commentary reflect those of Sterling Capital Management LLC, and not those of BB&T Corporation or its executives. The stated opinions are for general information only and are not meant to be predictions or an offer of individual or personalized investment advice. They also are not intended as an offer or solicitation with respect to the purchase or sale of any security. This information and these opinions are subject to change without notice. Any type of investing involves risk and there are no guarantees. Sterling Capital Management LLC does not assume liability for any loss which may result from the reliance by any person upon any such information or opinions. Investment advisory services are available through Sterling Capital Management LLC, a separate subsidiary of BB&T Corporation. Sterling Capital Management LLC manages customized investment portfolios, provides asset allocation analysis and offers other investment-related services to affluent individuals and businesses. Securities and other investments held in investment management or investment advisory accounts at Sterling Capital Management LLC are not deposits or other obligations of BB&T Corporation, Branch Banking and Trust Company or any affiliate, are not guaranteed by Branch Banking and Trust Company or any other bank, are not insured by the FDIC or any other government agency, and are subject to investment risk, including possible loss of principal invested.


